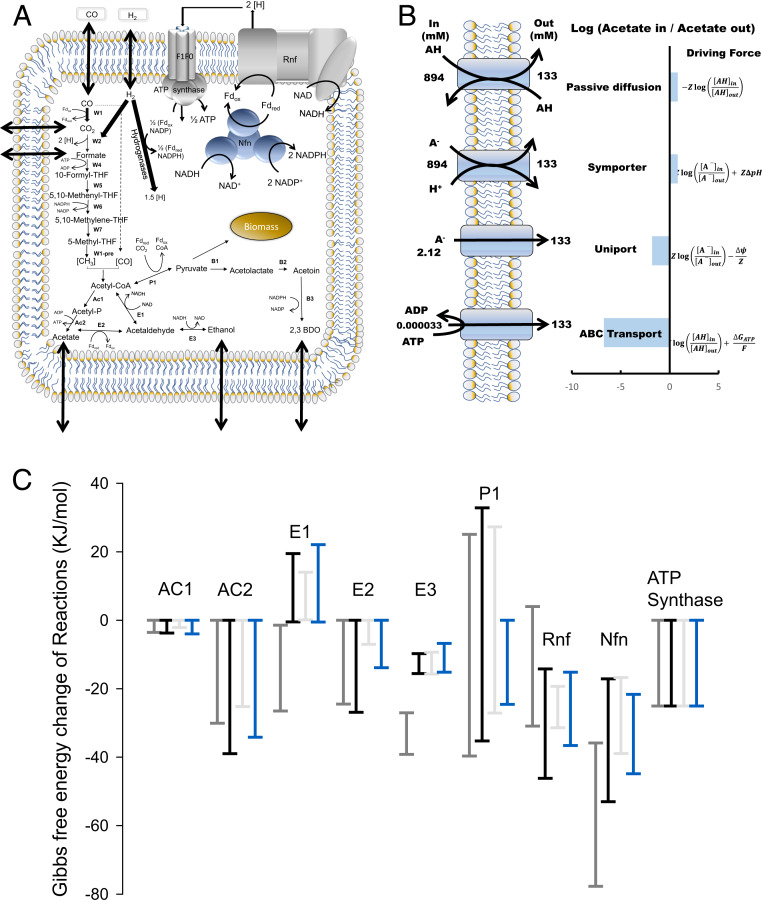
Fig. 3.
tMFA of C. autoethanogenum. (A) Schematic representation of our tMFA model of C. autoethanogenum. Arrows across the cell membrane denote product transport. (B) Modeling four mechanisms for acetate transport which were then used in our tMFA model. See Results and Dataset S1 . 2,3-BDO, 2,3-butanediol; THF, tetrahydrofolate; Fd, ferredoxin; A−, acetate; AH, acetic acid; H+, proton. (C) The plot shows the maximum allowable range of Gibbs free energy for respective reactions at given conditions calculated using thermodynamic variability analysis. Gray and black show the three phases from this work, and blue shows data from the steady state. See Results for details; Each bar denotes mean and error bars SD of that allowable range. *Positive reactions are thermodynamically not feasible at given conditions (have positive Gibbs free energy change).

