Fig. 2.
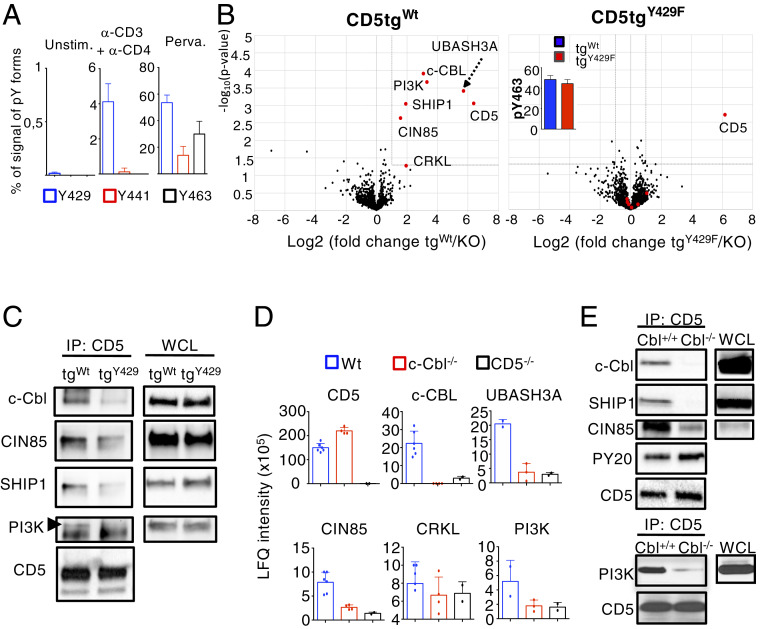
c-CBL is recruited to CD5 Y429 and is connecting CD5 with its signaling partners. (A) MS analysis of CD5 phosphorylation sites. Thymocytes from WT mice were left unstimulated (Unstim.) or were stimulated with anti-CD3 + anti-CD4 antibodies or pervanadate (Perva.) for 1 min. Samples were then subjected to IP with antibodies specific for CD5. MS intensity of peptide ions containing the three main phosphotyrosine residues of the protein were used to calculate for each site the percentage of MS signal deriving from modified phosphotyrosine forms. MS intensity values of phosphorylated ions were averaged for MS replicate measurements of each sample. Data are the means ± SD and represent three independent experiments containing n = 1 mouse per group. (B) Volcano plots [−log10(Student t test P value) versus log2(fold-change)] showing abundances difference of proteins identified by MS analysis of samples obtained by IP of CD5 from cellular extracts of thymocytes stimulated with pervanadate. (Left) Comparison CD5tgWt vs. Cd5−/− thymocytes (n = 6 independent samples); (Right) comparison CD5tgWt versus Cd5−/− thymocytes (n = 5 independent samples). Protein labeled in red show significant enrichment in CD5tgWt samples compared to control Cd5−/− samples (fold-change > 2 and P < 0.05). The same proteins plotted in red show no significant enrichment in CD5tgY429F samples versus controls. Bar graph (Inset ) in the CD5tgY429F volcano plot represent the MS intensity (log10) of CD5 phosphorylated peptides containing the Y463 of CD5. (C) Thymocytes from CD5tgWt or CD5tgWt mice were stimulated with anti-CD3 + anti-CD4 for 1 min. Samples were then subjected to IP with antibodies specific for CD5 and then analyzed by Western blotting with antibodies specific for the indicated proteins. (D and E) CD5 was immunoprecipitated from cellular extracts of total thymocytes from the indicated genotypes stimulated with pervanadate. Samples were analyzed by MS (D) or Western blot (E). Abundance of specific interacting partners was estimated based on MS signal intensity. Data are means ± SD from at least two MS measurements and are representative of two experiments containing n = 1 mouse per group. Western blots are representative of two independent experiments. WCL, whole cell lysate.

