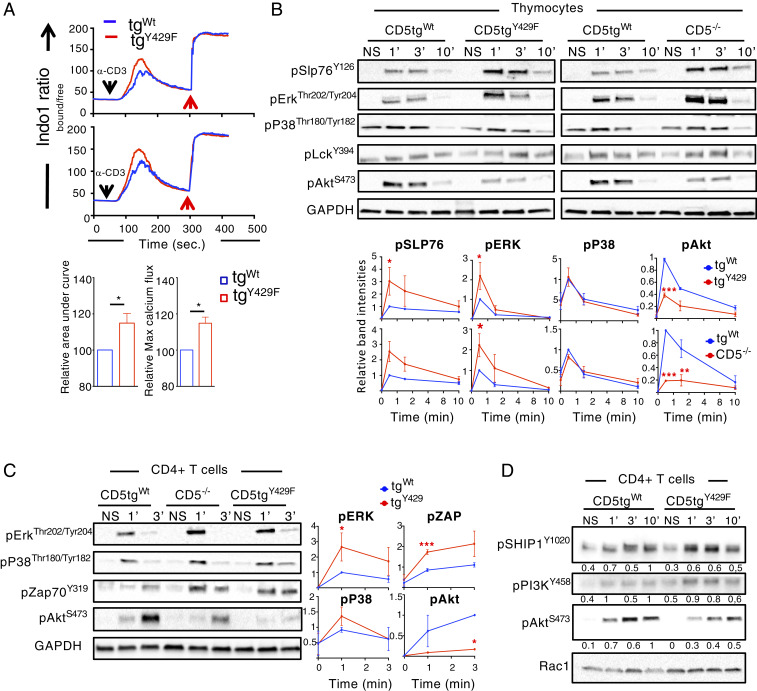
Fig. 3.
CD5 coordinates TCR signals in thymocytes and peripheral T cells. (A) Analysis of calcium flux in DP thymocytes from CD5tgWt and CD5tgY429F mice stimulated with anti-CD3 antibodies at 5 or 10 µg/mL (Upper and Lower graph, respectively) in the presence of anti-CD4 antibodies. Red arrows indicate maximum responses following stimulation with ionomycine. Bar graphs represents the area under the curve and the maximum peak intensity of calcium flux normalized to the values obtain in DP thymocytes from CD5tgWt mice. Data are means ± SD and are representative of two independent experiments with n = 1 to 2 mice per group. (B) Thymocytes from CD5tgWt, CD5tgY429F, and Cd5−/− mice were stimulated with anti-CD3 + anti-CD4 antibodies for the indicated times. Total cytoplasmic extracts of the cells were then analyzed by Western blotting with antibodies against phosphorylated forms of SLP76, ERK, P38, LCK, and AKT. Curves show the relative abundances of the indicated phosphorylated proteins as determined by calculating the ratios of the intensities of the bands corresponding to the phosphorylated proteins to those corresponding to GAPDH, the loading control. The y axes represent means ± SD of the relative values calculated after normalization to the highest value in the CD5tgWt cells. Data are representative of three to five independent experiments, each including one mouse of the indicated genotype. (C and D) Peripheral CD4+ T cells from CD5tgWt, CD5tgY429F and Cd5−/− mice were stimulated with anti-CD3 antibodies for the indicated times. Total cytoplasmic extracts of the cells were then analyzed by Western blotting with antibodies against phosphorylated forms of SLP76, ERK, P38, ZAP-70, PI3K, SHIP1, and AKT. Curves or values next to the blots show the relative abundances of the indicated phosphorylated proteins calculated as in B. Data are representative of two to four independent experiments each including one mouse of the indicated genotype. Unpaired two-tailed t test. *P < 0.05; **P < 0.01; ***P < 0.001.

