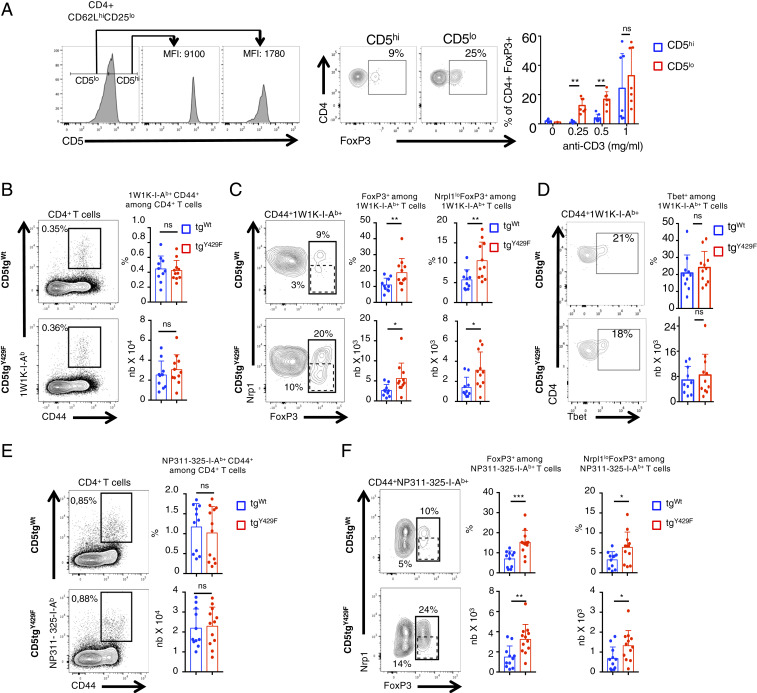
Fig. 6.
CD5-mediated signaling restrain the generation of peripherally induced Treg cells following immunization with foreign antigens and viral infection. (A) CD5lo and CD5hi naïve CD62LhiCD25lo CD4+ T cells from C57BL/6 mice were sorted prior to stimulation with anti-CD3 antibodies in presence of TFG-β for 3 d. Histograms show the sorting strategy. Contour plots represent CD4 versus FOXP3 staining profiles of CD5lo and CD5hi CD4+ T cells. Bar graphs represent the percentages of FOXP3+ CD4+ T cells following stimulation with the indicated doses of anti-CD3 antibodies in presence of TGF-β. Data are means ± SD and represent two independent experiments with n = 7 mice per group. (B–D) CD5tgWt and CD5tgY429F mice were immunized with 1W1K peptide in presence of IFA. Draining lymph nodes were collected after 7 d and analyzed by flow cytometry after staining of the cells with 1W1K-conjugated MHC tetramers. (E and F) CD5tgWt and CD5tgY429F mice were intranasally infected with PR8 virus. Draining lymph nodes were collected after 5 d and analyzed by flow cytometry after staining of the cells with NP311-325-conjugated MHC tetramers. (B and E) Contour plots represents CD44 versus tetramer staining profile on gated CD4+ T cells. Bar graphs represent the percentages and absolute numbers of tetramer+CD44+ T cells among CD4+ T cells. (C and F) Contour plots represents FoxP3 vs. Neuropilin1 (Nrp1) staining profile on gated tetramer+CD44+ CD4+ T cells. Bar graphs represent the percentages and absolute numbers of either FoxP3+ (solid gate) or FoxP3+ neuropilinlow (dashed gate) among tetramer+CD44+ CD4+ T cells. Data are representative of two independent experiments and are means ± SD of at least 10 mice for each genotype. Nonparametric t test *P < 0.05; **P < 0.01; ***P < 0.001.

