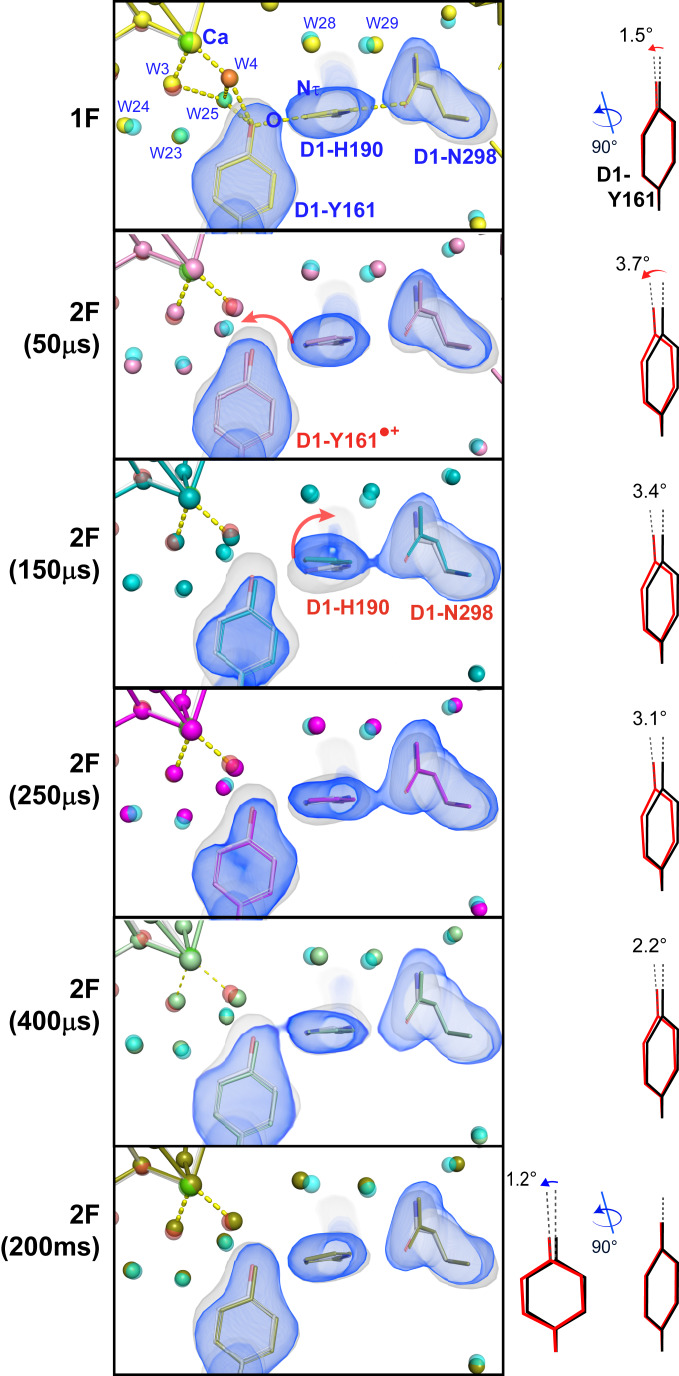
Fig. 3.
Fo-Fc electron density omit map of the 0F data (gray) and model (gray) overlaid with the Fo-Fc omit maps (blue) and the models for 1F (yellow) and 2F time points (50 µs: pink; 150 µs: cyan; 250 µs: magenta; 400 µs: green; 200 ms: olive) in the region of D1-Tyr161 (YZ). D1-Tyr161, D1-His190, and D1-Asn298 (which were omitted for map generation) are shown together with the Ca of the Mn4Ca cluster. The tilt angle of the Tyr phenol ring with respect to the 0F structure (black) is shown at the right for each state (red). Within 50 µs the electron is transferred from YZ to P680•+ as seen by the change in electron density around YZ. At 150 µs, YZ, D1-His190, and D1-Asn298 all move away from the Mn4Ca cluster, indicating H-bonding changes that could be connected to proton transfer processes. In the 250-µs data, D1-His190 and D1-Asn298 are back in their original positions and from there onward YZ/YZox slowly returns to the position prior to the light flash, reflecting the reduction of YZox by the Mn4Ca cluster.

