Fig. 4.
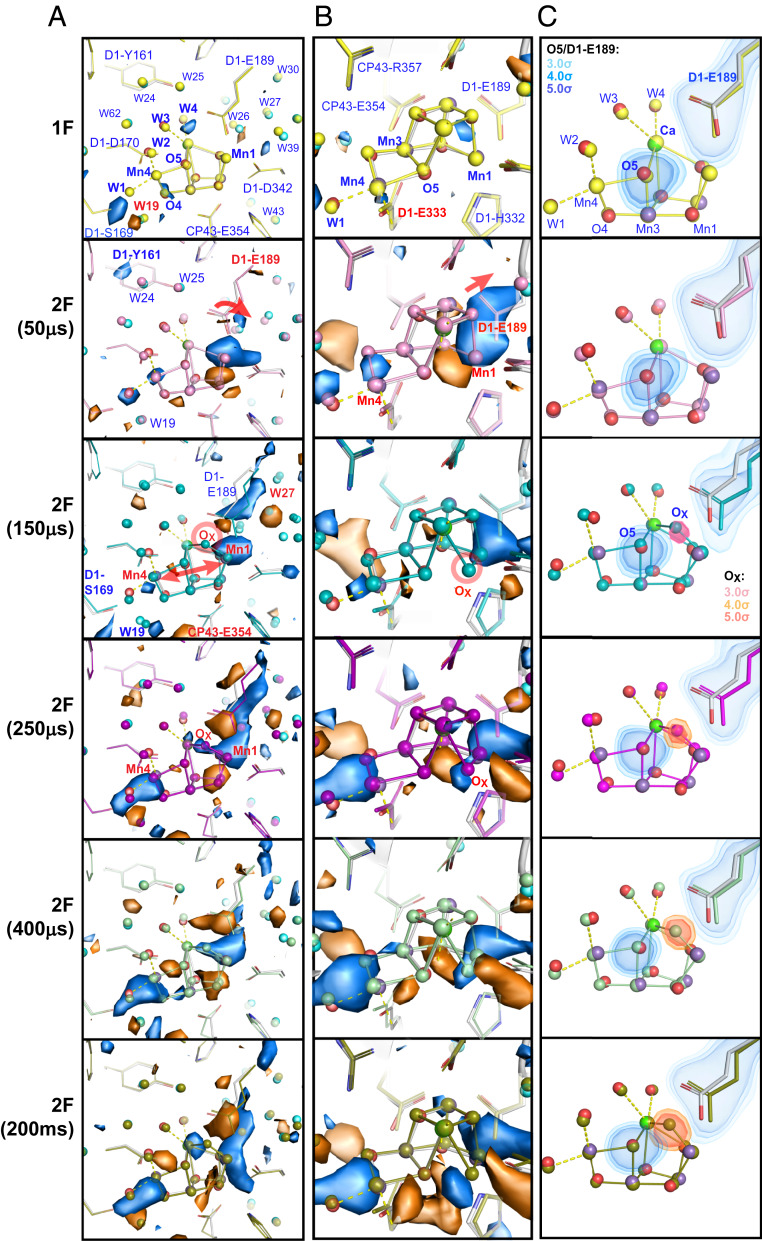
Structural changes at the OEC in the S2→S3 transition. (A and B) Fo-Fo isomorphous difference maps (± 3 σ in blue and orange) of 1F-0F and 2F(time point)-0F datasets in the region of the OEC in two different views for monomer I. (C) Fo-Fc omit maps obtained upon separately omitting D1-Glu189 (blue), O5 (blue), and OX (red), respectively. The dark-state structure is shown as a ball and stick model (carbons in gray, nitrogens in blue, oxygens in red, unbound waters in cyan) overlaid with refined models for various illumination conditions indicated in the left margin. The 1F-0F (S2-S1) isomorphous difference map does not feature any significant changes at the OEC (except the disappearance of W20, not shown here but see ref. 20, and the concomitant change in position for W19). At 50 µs the movement of Glu189 away from Ca is seen, followed by Mn1–Mn4 moving apart and OX binding between Mn1 and Ca from 150 µs onward. The omit maps show the shift of Glu189 starting at 50 µs and more dominantly at 150 µs, while the OX density appears in the maps starting at 150 µs. While there are slight differences in the two PS II monomer sites (monomer I and II), the overall trend is the same on both sites.

