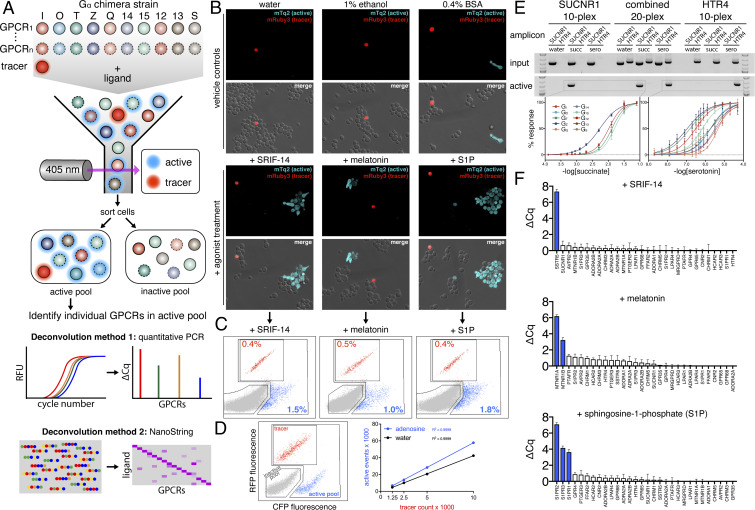
Fig. 2.
Developing and validating DCyFIRplex. (A) Schematic of the DCyFIRplex workflow showing strain consolidation to build the multiplex, FACS to collect active receptor strain pools, and our two primary multiplex deconvolution techniques. (B) Confocal microscopy images of treated and untreated (vehicle) samples of the GPCR–Gα 300-plex with the added mRuby3 tracer strain (maximum intensity projections, 63X magnification). (C) FACS analysis of the inactive (gray), active (cyan), and tracer (red) pools for the 300-plex shown in B. (D) FACS analysis of negative (gray), positive (cyan), and tracer (red) controls (see Methods for details); also, a representative standard curve of tracer event counts versus active pool event counts for our reference conditions of ±adenosine used to calibrate the FACS sorting procedure. Tracer event counts between 3,000 and 5,000 gave the most consistent deconvolution results. (E) PCR deconvolution of SUCNR1 and HTR4 10-plexes and combined 20-plex visualized by gel electrophoresis; also, the family of normalized titration curves that corresponded to the active GPCR–Gα strains in each 10- and 20-plex (errors bars represent the SD of n = 4 experimental replicates). (F) DCyFIRplex profiles deconvoluted via qPCR for the agonist-treated 300-plexes characterized in B and C. Expected hits are colored blue. ΔCq values correspond to the Cq difference between treated and untreated conditions, with error bars representing the SEM of n = 6 repeats derived from 3 independent 300-plex consolidations deconvoluted in technical duplicate. ΔCq values correspond to a log2 scale.

