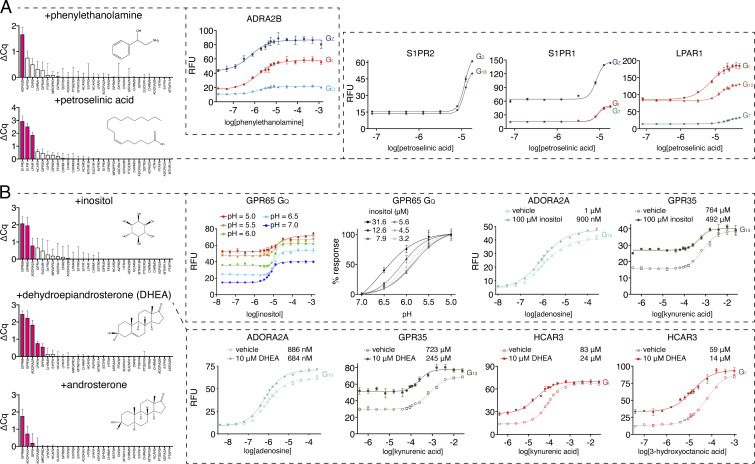
Fig. 6.
Identification and validation of GPCR–metabolite interactions. (A) DCyFIRplex profiles and titrations for metabolite agonists and (B) positive allosteric modulators. For B, full titration datasets for all GPCR–Gα coupling combinations are available in SI Appendix, Fig. S7. DCyFIRplex error bars represent the SEM of n = 6 repeats derived from 3 independent 300-plex consolidations deconvoluted in technical duplicate, and titration error bars represent the SD of n = 4 experimental replicates.

