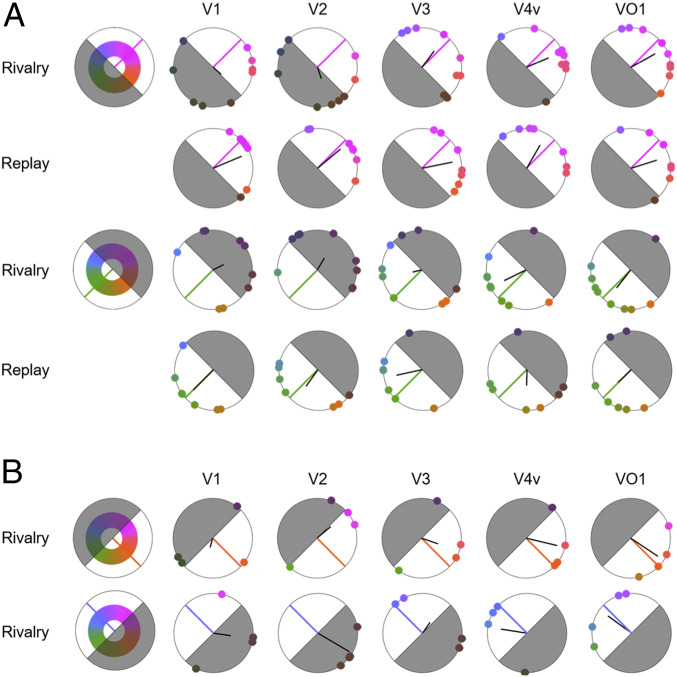
Fig. 3.
(A) Reconstructed magenta and green. The color represented in each visual area during switch rivalry and replay conditions was reconstructed and plotted in DKL color space. Each dot indicates the reconstructed color for one observer. The solid black line depicts the vector sum of the reconstructed color representations across observers; the solid colored line indicates each target color (magenta or green). The half of the hue plane opposite to the perceived color is shaded to indicate below-chance accuracy of the reconstructed color. (B) Reconstructed blue and orange. A blue–orange (135° to 315°) color pair was used with switch rivalry (four observers participated).

