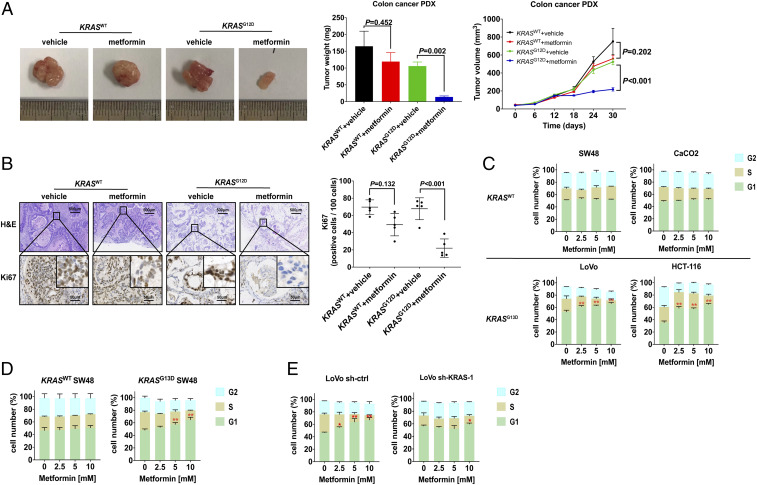
Fig. 2.
KRAS mutation enhances the antitumor activity of metformin in the CRC PDX animal model and CRC cells. (A and B) The representative morphology (A, Left), tumor weight (A, Middle), mean tumor growth rate (A, Right), and representative images of Ki67 immunohistochemistry and their corresponding H&E staining (B, Left) and statistical graph (B, Right) are shown as a result of 30-d treatment with metformin in 374469 KRASWT colon adenocarcinoma and 386650 KRASG12D colon mucinous adenocarcinoma patient-derived xenograft models. Data are shown as mean ± SEM, and differences between metformin and vehicle were analyzed by two-way ANOVA. (C–E) The distribution of G1, S, and G2 phases in KRASWT CRC cell lines SW48 and CaCO2, KRASG13D CRC cell lines LoVo and HCT-116 (C), KRASG13D SW48 established by the CRISPR-Cas9 system (D), and LoVo infected by shRNA lentivirus (E) were detected after treatment with 0, 2.5, 5, and 10 mM metformin for 24 h (n = 3). Data are shown as mean ± SEM. *P < 0.05, **P < 0.01 was compared with 0 mM metformin. All P values were determined by two-way ANOVA.

