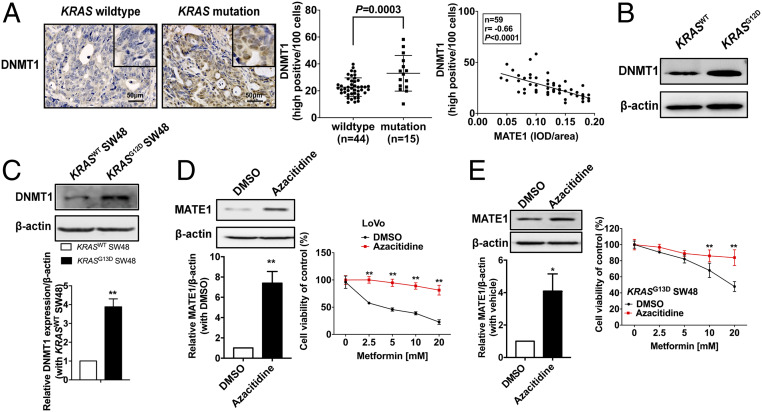
Fig. 6.
Transcriptional silencing of MATE1 by hypermethylation in KRAS-mutation CRC cells is associated with the up-regulation of DNMT1. (A) Representative images of DNMT1 immunohistochemistry on cross-sections from mCRC patients with T2DM were shown (Left); cells with high positive DNMT1 expression were counted by ImageJ software, and the proportion was presented by two-way ANOVA (Middle); the association between the IOD of MATE1 (shown in Fig. 3 D and E) and cell proportion with high positive DNMT1 expression was determined by Pearson’s correlation analysis (Right). (B and C) Expression levels of DNMT1 in 374469 KRASWT colon adenocarcinoma and 386650 KRASG12D colon mucinous adenocarcinoma (B) and in KRASG13D SW48 (C) were analyzed by immunoblot. (D and E) Immunoblot analysis of MATE1 level (Left) and 48-h cell viability (Right) in LoVo (D) or KRASG13D SW48 (E) cultured in 10 μM azacitidine for more than three generations (n = 3). Data are shown as mean ± SEM. *P < 0.05, **P < 0.01 compared with the DMSO group. All P values were determined by two-way ANOVA.

