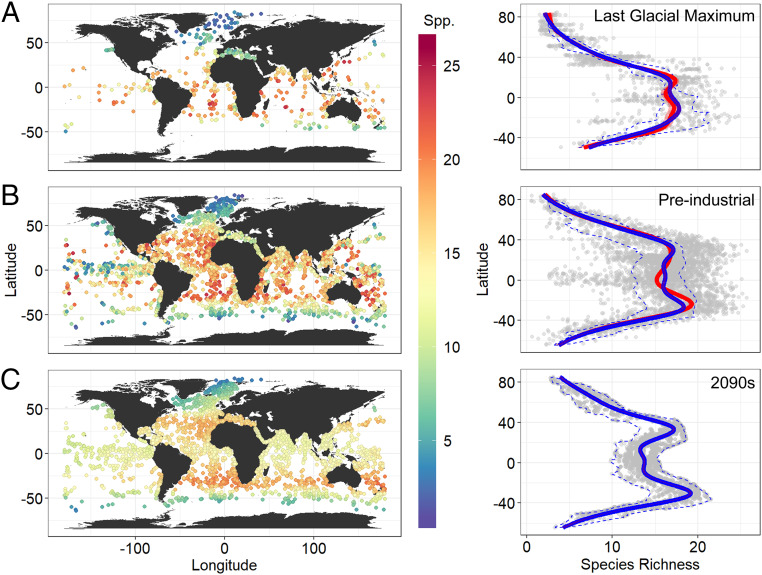
Fig. 1.
Species richness of planktonic foraminifers during the (A) LGM, (B) PIC, and for (C) 2091 to 2100 (2090s) as maps and latitudinal gradients. Colored and gray dots (in the maps and the latitudinal gradients, respectively) indicate the observed diversities in A (LGM) and B (PIC). These observed LGM and PIC diversities were modeled by SST, coordinates, and ocean basin using a GAM to predict the diversities in 2090s (colored and gray dots in C) with future SST (based on RCP 8.5) as well as those during the LGM and PIC themselves. The predicted latitudinal diversities for the three time periods (enclosed by blue dashed lines) were smoothed by a GAM to show LDGs (blue lines). The latitudinal gradients of observed diversities during the LGM and PIC were also fitted by a GAM and shown as the red lines with the shaded areas indicating the 95% CIs (the shaded area is small, overlaps the red line, and so is not visible in the PIC panel). For the LGM and PIC gray dots, a small amount of jitter was added on the x axis to make them visible when overlapping. SI Appendix, Fig. S1 shows empirical and projected diversities using a Hill number of order q = 1.

