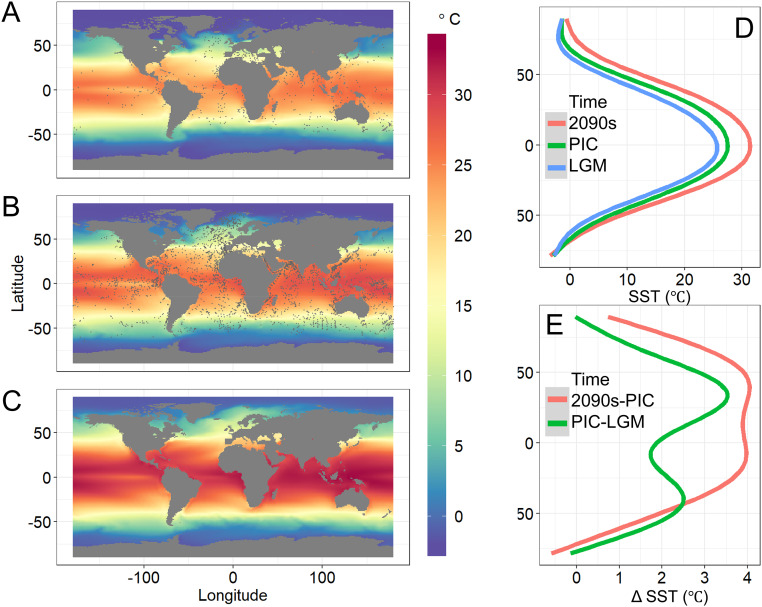
Fig. 2.
Maps and latitudinal gradients of the projected ocean SST during the (A) LGM, (B) PIC, and (C) 2091 to 2100 (2090s) based on RCP 8.5. The latitudinal SST (LGM: blue; PIC: green; 2090s: red) and ΔSST (warming from the LGM to PIC as green and from the PIC to 2090s as red) are smoothed by a GAM and shown in D and E, respectively. Gray dots in A and B indicate sample locations.

