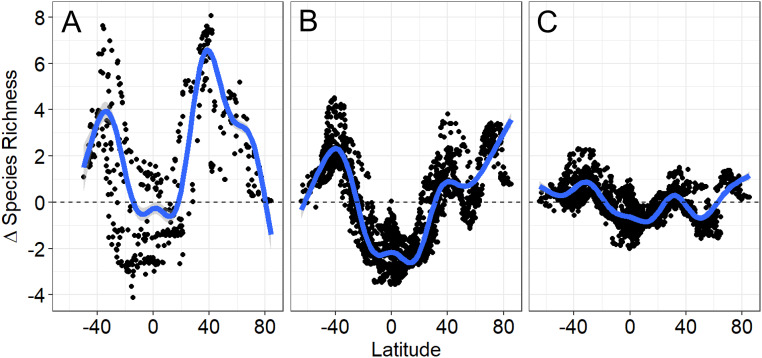
Fig. 3.
Changes in predicted species richness (∆ species richness) from the LGM to PIC (A), from the PIC to RCP 8.5 2090s (B), and from the PIC to RCP 2.6 2090s (C). Species richness was predicted using SST for LGM, PIC, RCP 8.5 2090s, and RCP 2.6 2090s. The ∆ species richness was calculated for the LGM samples in A and PIC samples in B and C and smoothed by a GAM (blue lines with the gray shaded areas indicating the 95% CIs that are small and not visible in B and C).

