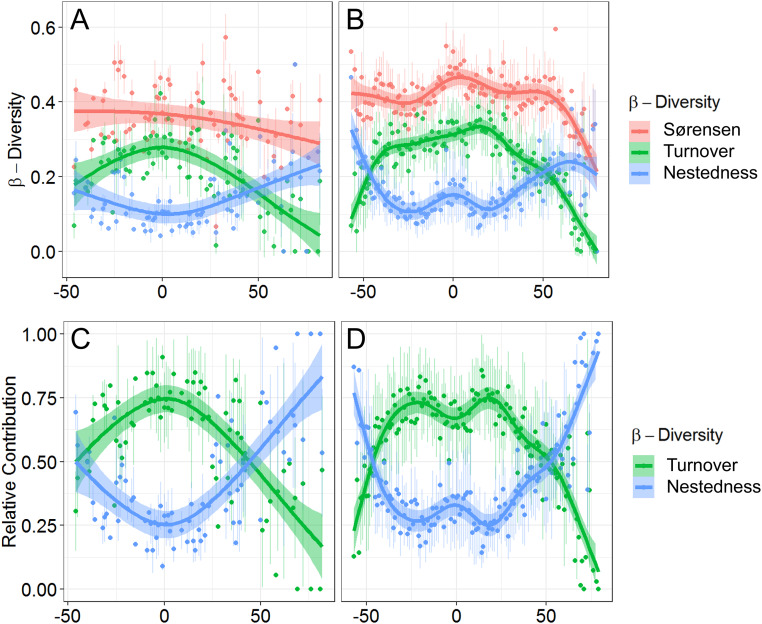
Fig. 4.
The latitudinal gradients in beta diversity during (A) the LGM and (B) the preindustrial periods. The total beta diversity (i.e., Sørensen dissimilarity [red]) was separated into turnover (green) and nestedness (blue) components. C and D show the relative contribution of the turnover (green) and nestedness (blue) components to total dissimilarity for the LGM and preindustrial periods, respectively. Colored dots and error bars show mean and SD from 1,000 bootstrap resampling within a 1° moving window. Colored lines with shaded areas show GAM fit to the mean values and 95% CI.

