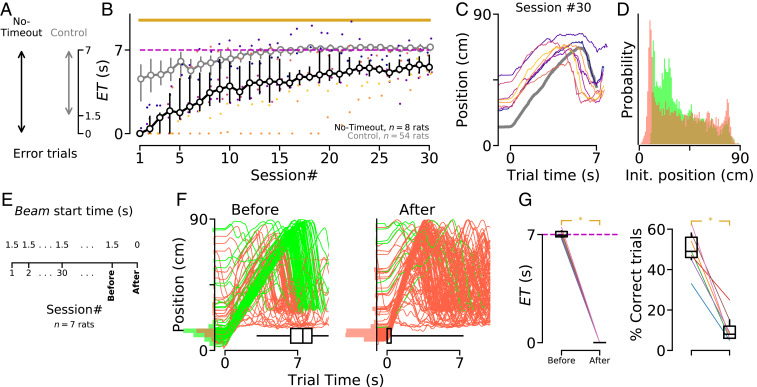
Fig. 3.
Decreased temporal accuracy when animals are penalized for starting trials in the reward area. (A) In control condition, animals had a 1.5 s timeout period to leave the reward area after motor onset. In “no-timeout” condition, crossing the infrared beam any time before 7 s is considered as an error. (B) Median for animals trained in the no-timeout (black) and control (gray) conditions. Colored dots indicate performance for individual “no-timeout” animals. Yellow line shows statistically significant differences between groups (permutation test; SI Appendix, Methods). The dashed magenta line shows the GT. (C) Median trajectory of no-timeout animals (same colors as in B) in session #30. (D) PDF of the no-timeout animals’ positions at the beginning of each trial, from sessions #20 to #30. (E) After extensive training in control condition, animals () were tested in a no-timeout probe session, in which the beam started at the beginning of the trial, rather than 1.5 s later. (F) Trajectories of a representative animal in (Left) the last “control” and (Right) the probe session. (G) (Left) Median s and (Right) percentage of correct trials in the sessions immediately before and after the change in beam start time. Each line represents a single animal. Asterisks indicate significant differences (nonparametric paired comparison; SI Appendix, Methods). Box plots show data range (center line, median; box, 25th and 75th percentiles; whiskers, 5th and 95th percentiles).

