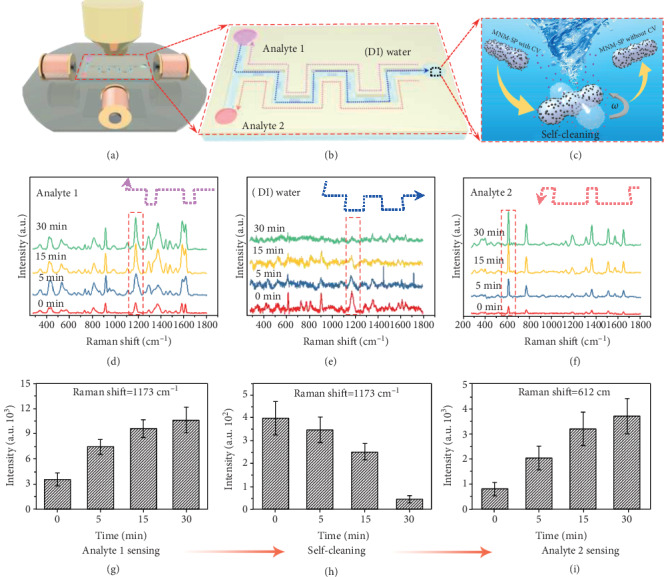
Figure 3.

Targeted SERS sensing and self-cleaning of the MNM-SP. Schematic illustration of (a) the setup showing the on-chip experiment. (b) Schematic illustration showing manipulation of the MNM-SP self-cleaning and sensing process: the MNM-SPs moved to the tank containing CV for analyte 1 sensing (pink dotted line); then, the contaminated MNM-SPs by the CV moved to the tank with deionized (DI) water for self-cleaning (blue dotted line), and finally the cleaned MNM-SPs were reused for analyte 2 sensing (red dotted line). (c) Schematic illustration of the rotation-enabled self-cleaning of the MNM-SP. (d–f) The Raman spectra of the analyte 1 (CV) sensing, CV-contaminated probes during self-cleaning, and analyte 2(R6G) sensing, respectively, with different rotating times. (h–j) The intensity variation of the prominent peaks of CV and R6G in (d–f), respectively. Error bars indicate standard deviation (N = 5).
