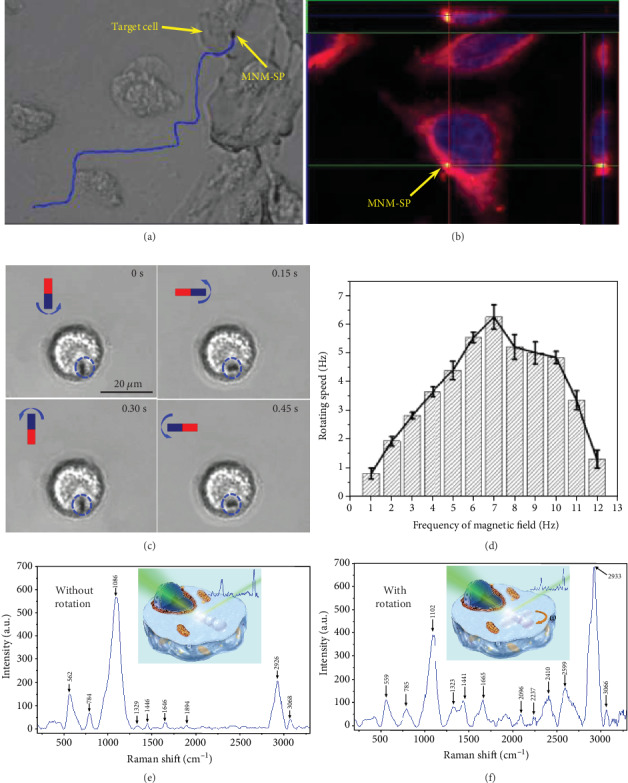
Figure 4.

Intracellular Raman sensing by a single MNM-SP. (a) Video snapshot of an MNM-SP approaching a target HepG-2 cancer cell by magnetic navigation. (b) CLSM image of an MNM-SP (yellow) uptaken into a cell. (c) Video snapshots of an MNM-SP rotating inside a living cell at different time intervals. (frequency of the rotary magnetic field (20 mT) is 2 Hz). (d) Rotating speed of the MNM-SP in the cell with different frequencies of the rotary magnetic field (20 mT). Typical SERS spectra from the site of the MNM-SP within an intracellular environment (e) before and (f) after rotation, respectively (inserted pictures are the schematic illustration of the intracellular SERS sensing by MNM-SP without and with rotation).
