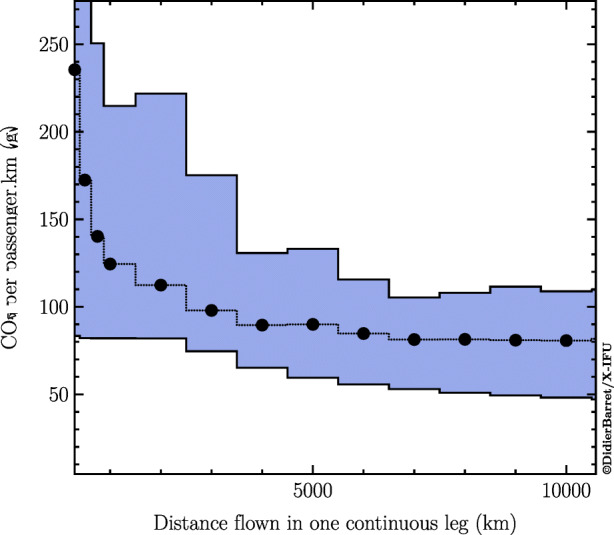
Fig. 14.

Range of emission factors (CO2 per passenger.km in g) as a function of the distance flown in one continuous leg (km). The lower and upper boundaries of the colored region are given by the minimum and maximum emission factors of the seven methods used by the calculator. The mean values of emission factors of the seven methods are shown with filled black circles. No multiplication factor, accounting for non-CO2 effect is applied, enabling the methods to be compared. The emission is computed assuming economy seating
