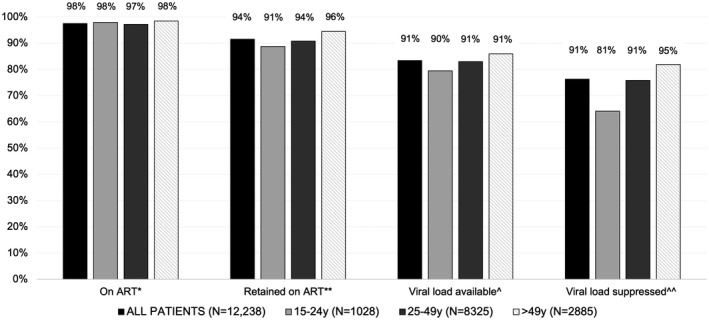
Figure 1.

Proportions of patients in HIV care on ART, retained on ART, with available viral load result, and with suppressed viral load, by age – 10 health centres, Rwanda, 2018 (N = 12,328). Note: Percentages above bars indicate proportion of patients meeting outcome among those achieving previous step in cascade. *Available ART initiation date in the study database, with no ART discontinuation prior to 1 January 2018. **≥2 post‐ART health centre visits ≥90 days apart during 2018. ^Viral load measured in 2018 and available in study database. ^^Most recent 2018 viral load <200 copies/mL.
