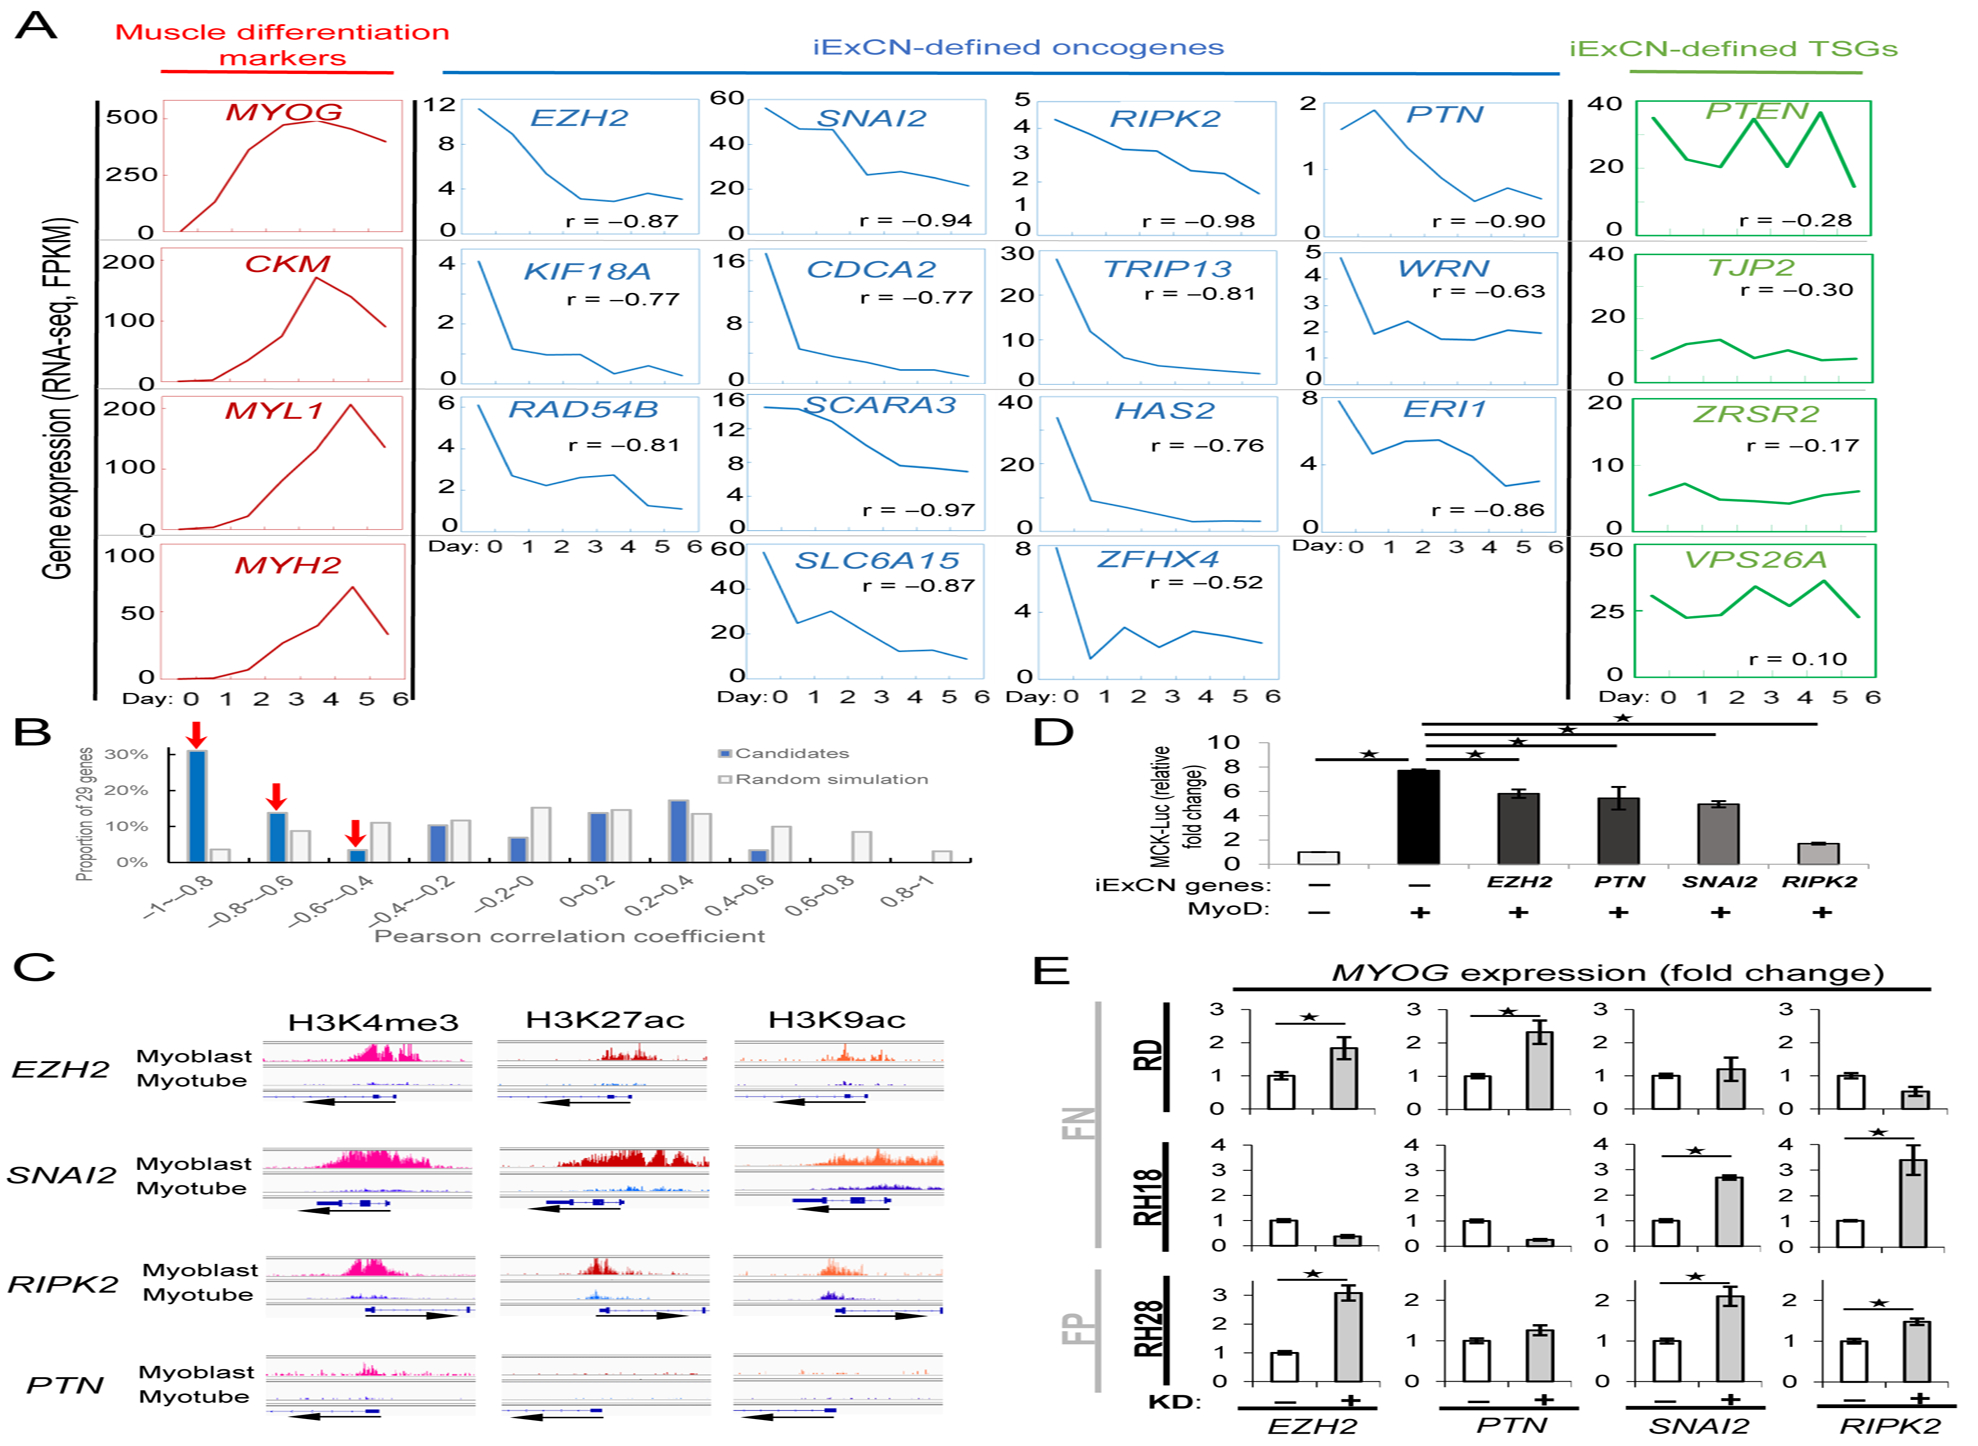
Figure 4. Expression of iExCN genes falls with skeletal muscle differentiation.

(A) Charts show gene expression for muscle differentiation markers (red), iExCN-derived oncogenic drivers (blue) and iExCN-derived TSGs (green) in human myoblasts cultured in growth medium (day 0) or differentiation medium for the indicated number of days (1–6).
(B) Chart displays the number of iExCN genes (blue bars) or genes randomly chosen from all those expressed in FN RMS (gray bars) with the indicated correlation to the degree of skeletal muscle differentiation. Pearson correlation coefficient near 0 indicates no correlation, whereas correlation coefficients of −1 or 1 indicate repression or induction of individual gene with muscle differentiation.
(C) Charts display ENCODE ChIP-seq data of H3K4me1 and H3K9ac, both of which are histone markers of active promoters, and H3K27ac, which is histone marker for active promoters and enhancers, in human myoblast and myotube on promoter regions of EZH2, PTN, SNAI2, or RIPK2.
(D) Chart demonstrates that ectopically expressed MyoD augments the expression of a muscle creatine kinase (MCK) enhancer/promoter reporter in 10T1/2 fibroblasts, whereas co-transfection of EZH2, PTN, SNAI2, or RIPK2 blunts MyoD activity. Data are average values from replicate samples, normalized to a co-transfected Renilla luciferase. Asterisks represent P value < 0.05 by two-tailed Student’s t-test.
(E) Charts show transient transfection of siRNA targeting EZH2, PTN, SNAI2, or RIPK2 or a scrambled control siRNA, (+ or −, respectively) influences the expression of MYOG in the indicated fusion positive (FP) and fusion negative (FN) cell lines. Asterisks represent P value < 0.05 by two-tailed Student’s t-test.
See also Figures S4 and S5.
