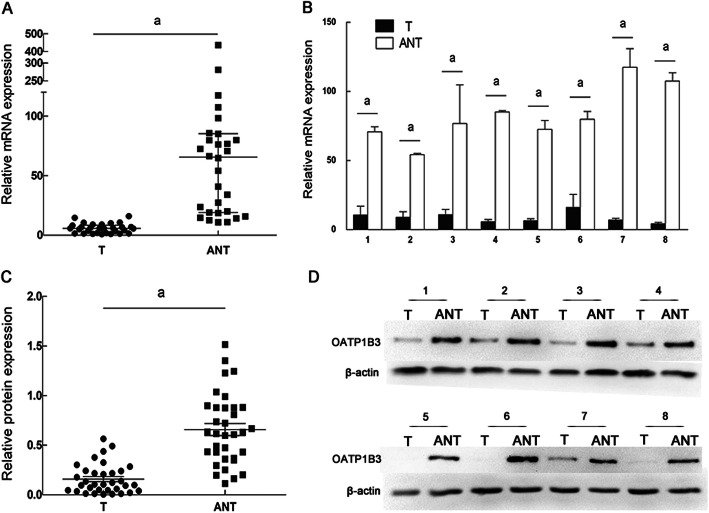
Fig. 2.
OATP1B3 mRNA and protein expression in HCC tissue and adjacent nontumorous tissues. a Relative expression of OATP1B3 was detected by qRT-PCR. OATP1B3 mRNA was higher in matched adjacent nontumorous tissue (ANT) than in HCC tissue (T) (n = 30). Relative mRNA expression in the ANT group showed abnormal distribution; thus, the Wilcoxon signed-rank test was applied, and the data are represented as the median ± interquartile range. b OATP1B3 mRNA expression levels in 8 pairs of Ts and ANTs were compared. Error bars represent the SD. c Relative expression of OATP1B3 protein was detected by Western blotting. OATP1B3 expression in T was significantly lower than that in ANT (n = 34). The data are represented as the mean ± SD, and the paired Student’s t test was applied. d Representative Western blot of OATP1B3 in T and ANT in 8 pairs of samples. Β-Actin was used as an endogenous control. aP < 0.05

