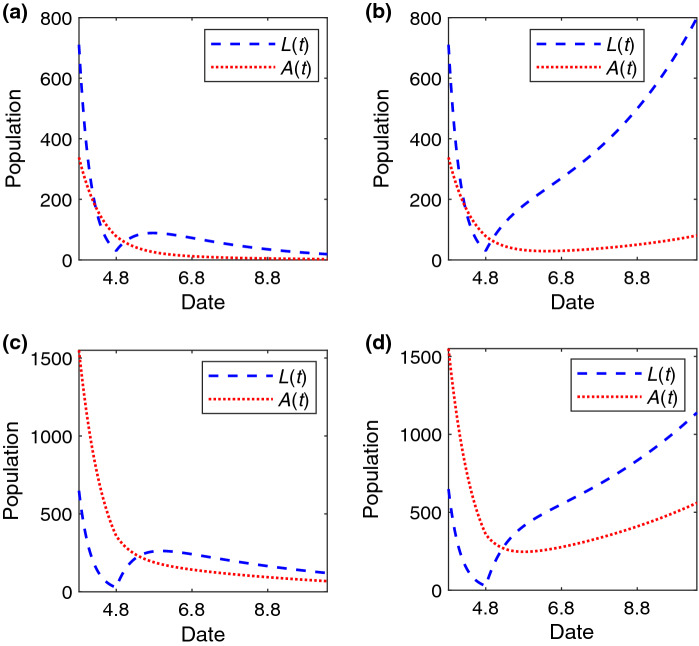
Fig. 4.
The change of A(t) and L(t) versus time (unit: day) under different after lifting the lockdown of the Wuhan. The temporal trend of the number of individuals in the A and L state when a , , b , , c , and d , . The values of other parameters are set to: , , , , before January 23, 2020, and later

