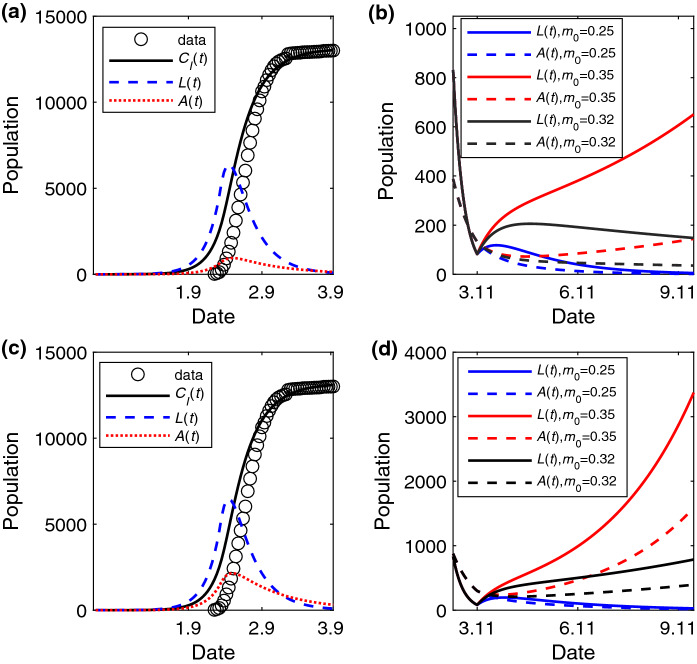
Fig. 5.
The change of epidemic features with time for different and . The fitting epidemic curve , the number of individuals in the L state L(t) and in the A state A(t) versus time (unit: day) with the estimated parameters , when in (a) and (b), and , when in (c) and (d). The change of A(t) and L(t) with different in (b) and (d). The data is the cumulative number of confirmed cases of China except for Hubei province in (a) and (c). The values of other parameters are set as: , , , ,

