
Fig. 6.
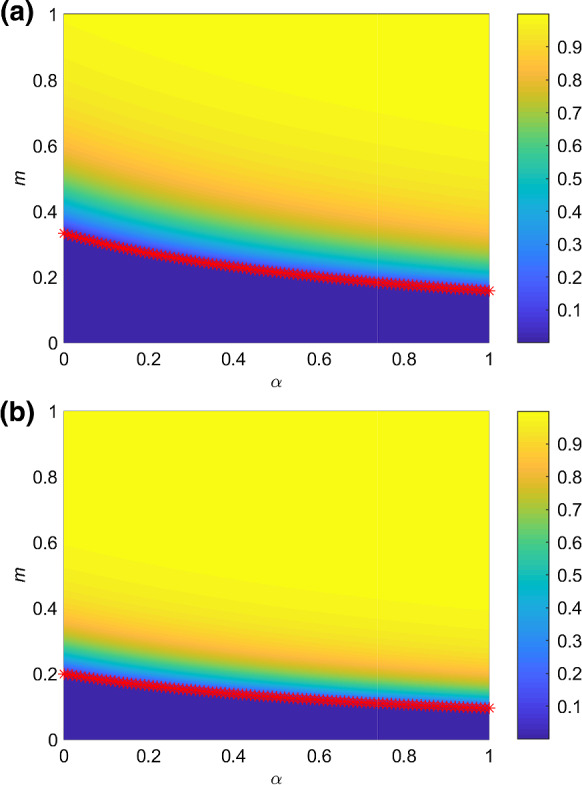
The color-coded values of total proportion of infected individuals who are recovered or dead at the end of the epidemic spreading in the parameter plane . m is the strength of control measures and is unchanged with time. The red asterisks indicate the value of with different according to Eq. (3). The spreading probability is a and b . The values of other parameters are set as: , , , ,