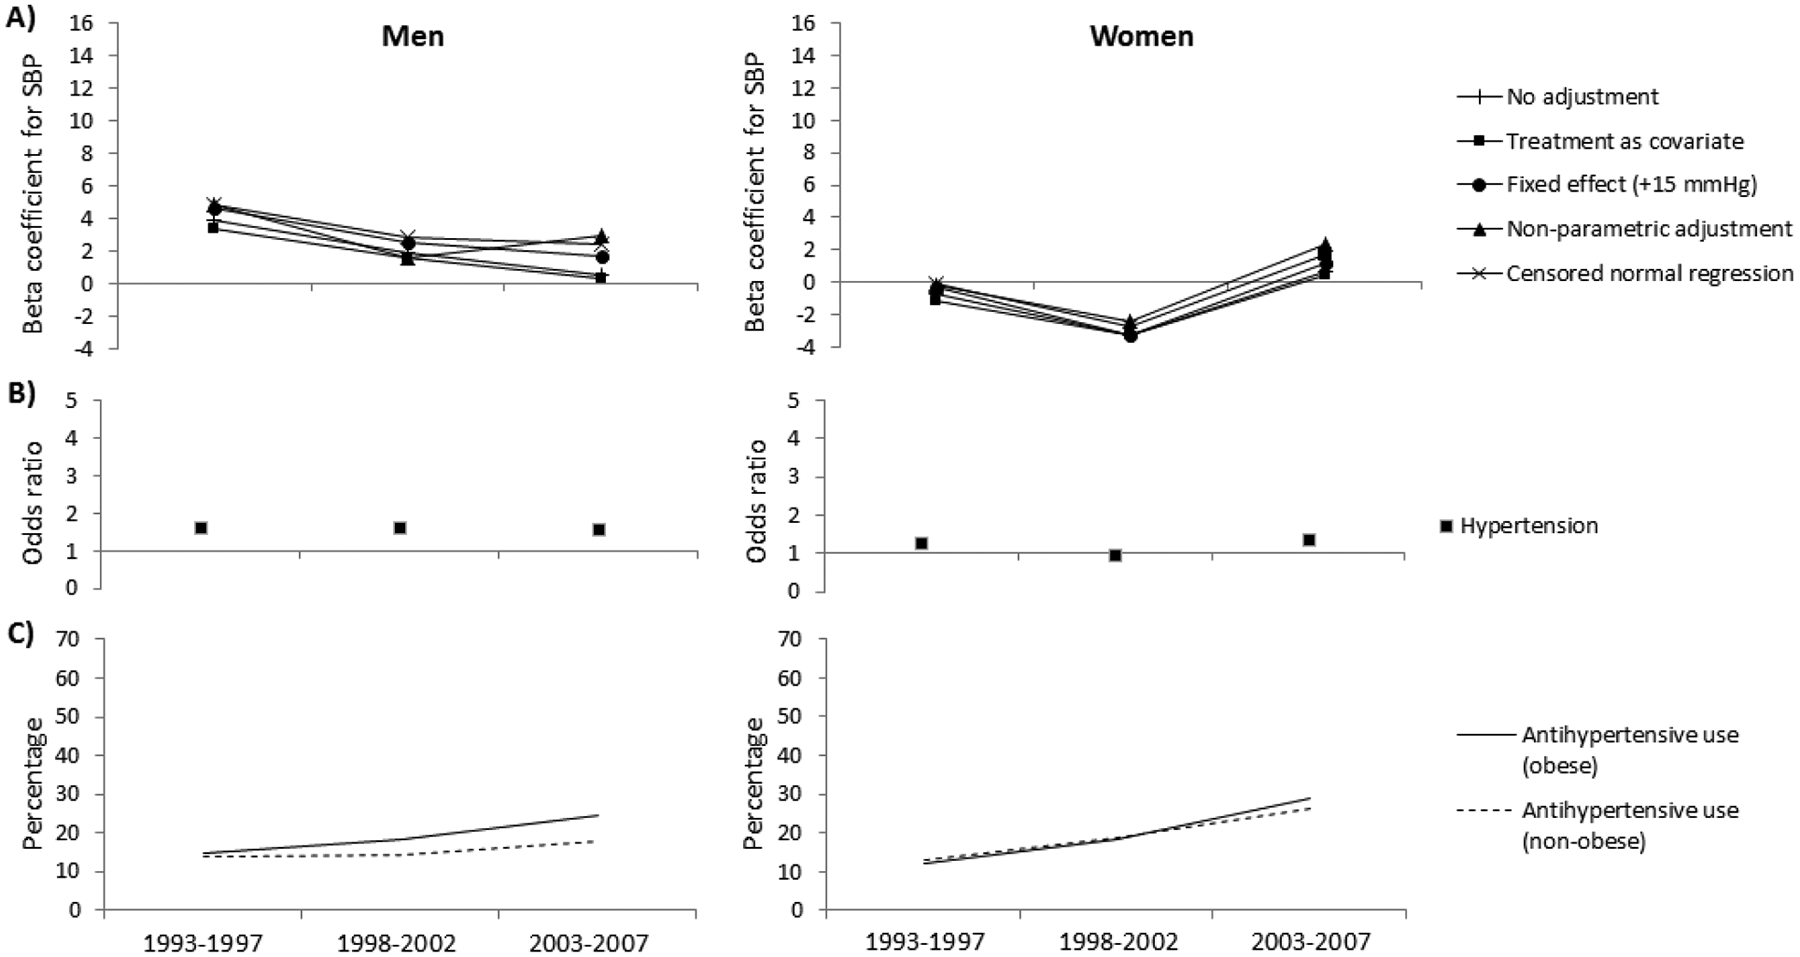
Figure 3.

(A and B) The relationship between systolic blood pressure (SBP) or hypertension and obesity, adjusted for age and using various adjustment methods for antihypertensive use, and (C) the percentage using antihypertensive therapy in the American Indian study. The beta coefficients represent the difference in SBP (mmHg) between persons who are and are not obese. The odds ratios represent the odds for hypertension in obese persons compared to those not obese.
