
Fig. 4. Effects of artCP on cardiomyocytes in vitro.
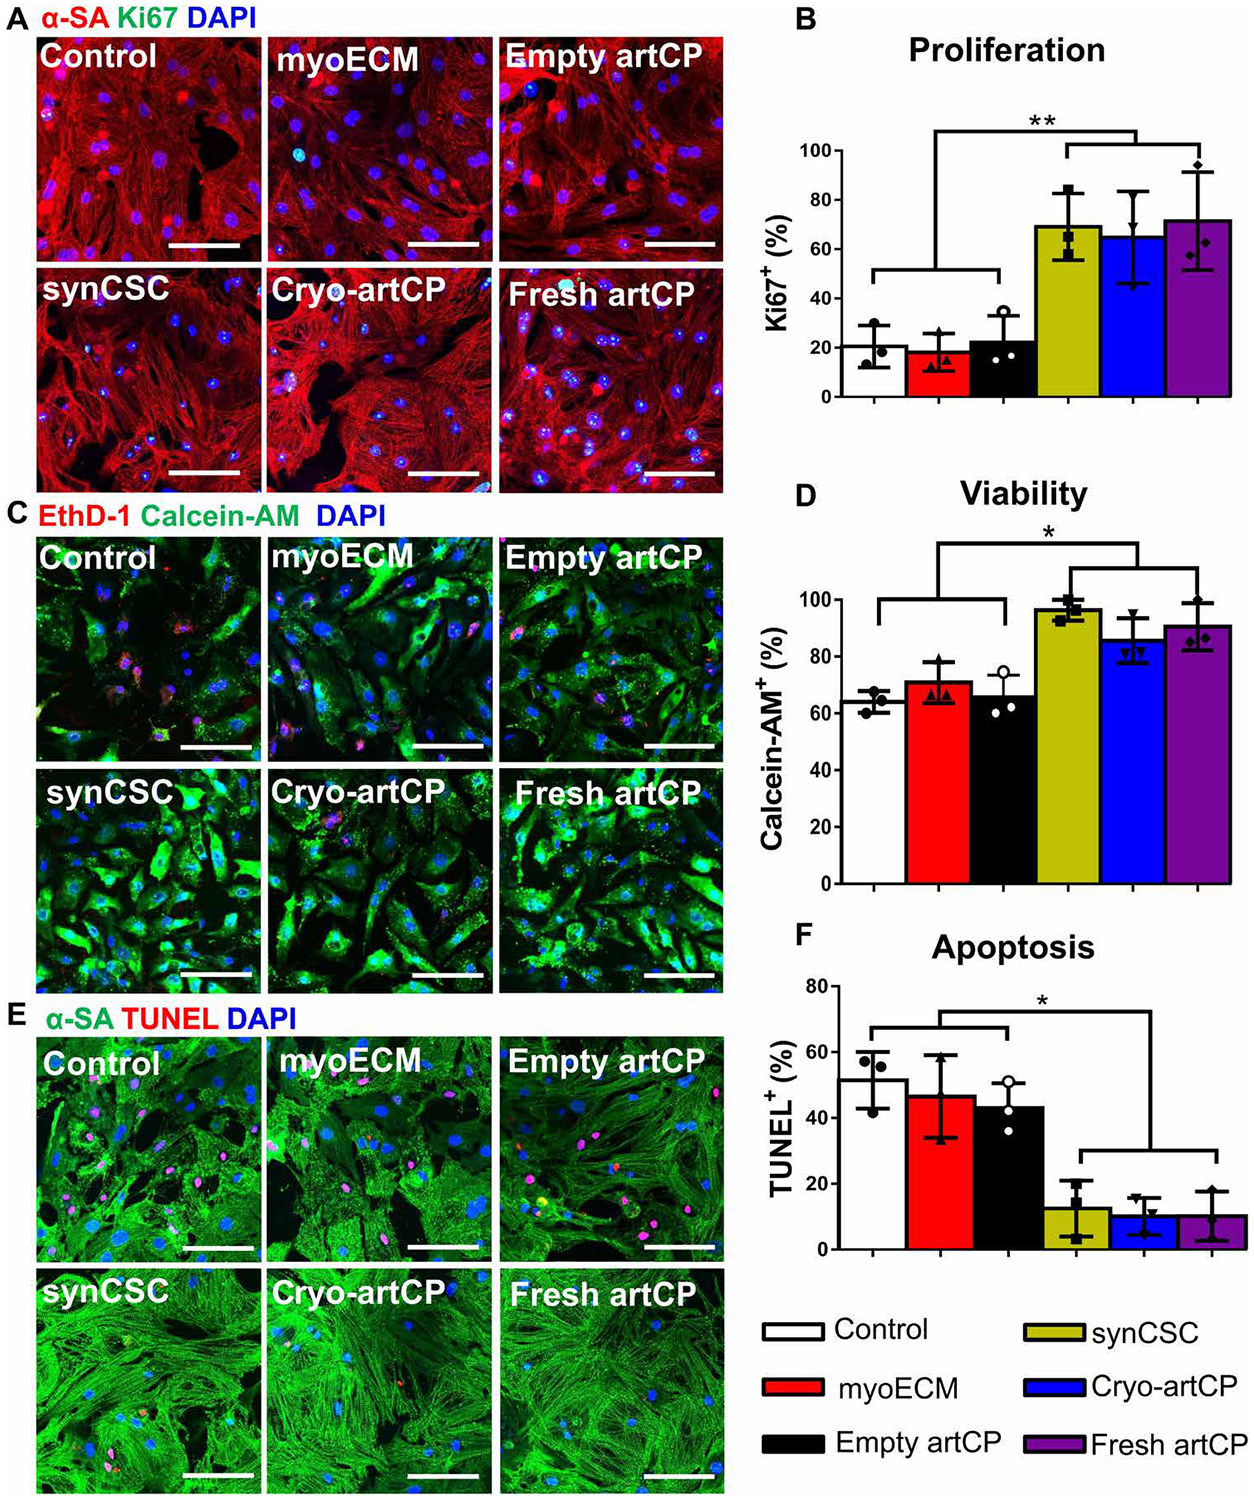
(A) Representative fluorescence micrographs showing Ki67+ expression (green) in NRCMs. Scale bars, 50 μm. α-SA, sarcomeric α-actinin. (B) Quantitation of Ki67+ cells in (A) (n = 3). (C) Representative fluorescence micrographs of LIVE/DEAD assay to determine the viability of NRCMs. Scale bars, 50 μm. (D) NRCM viability measured from (C) using ImageJ software (n = 3). (E) Representative fluorescence micrographs of cell apoptosis detected by terminal deoxynucleotidyl transferase–mediated deoxyuridine triphosphate nick end labeling (TUNEL) expression (red). Scale bars, 50 μm. (F) TUNEL+ NRCM percentage determined from (E) using ImageJ software (n = 3). All data are means ± SD. Comparisons among groups were performed using one-way ANOVA followed by post hoc Bonferroni test. The comparisons between samples are indicated by lines, and the statistical significance is indicated by asterisks above the lines. *P < 0.05 and **P < 0.01.