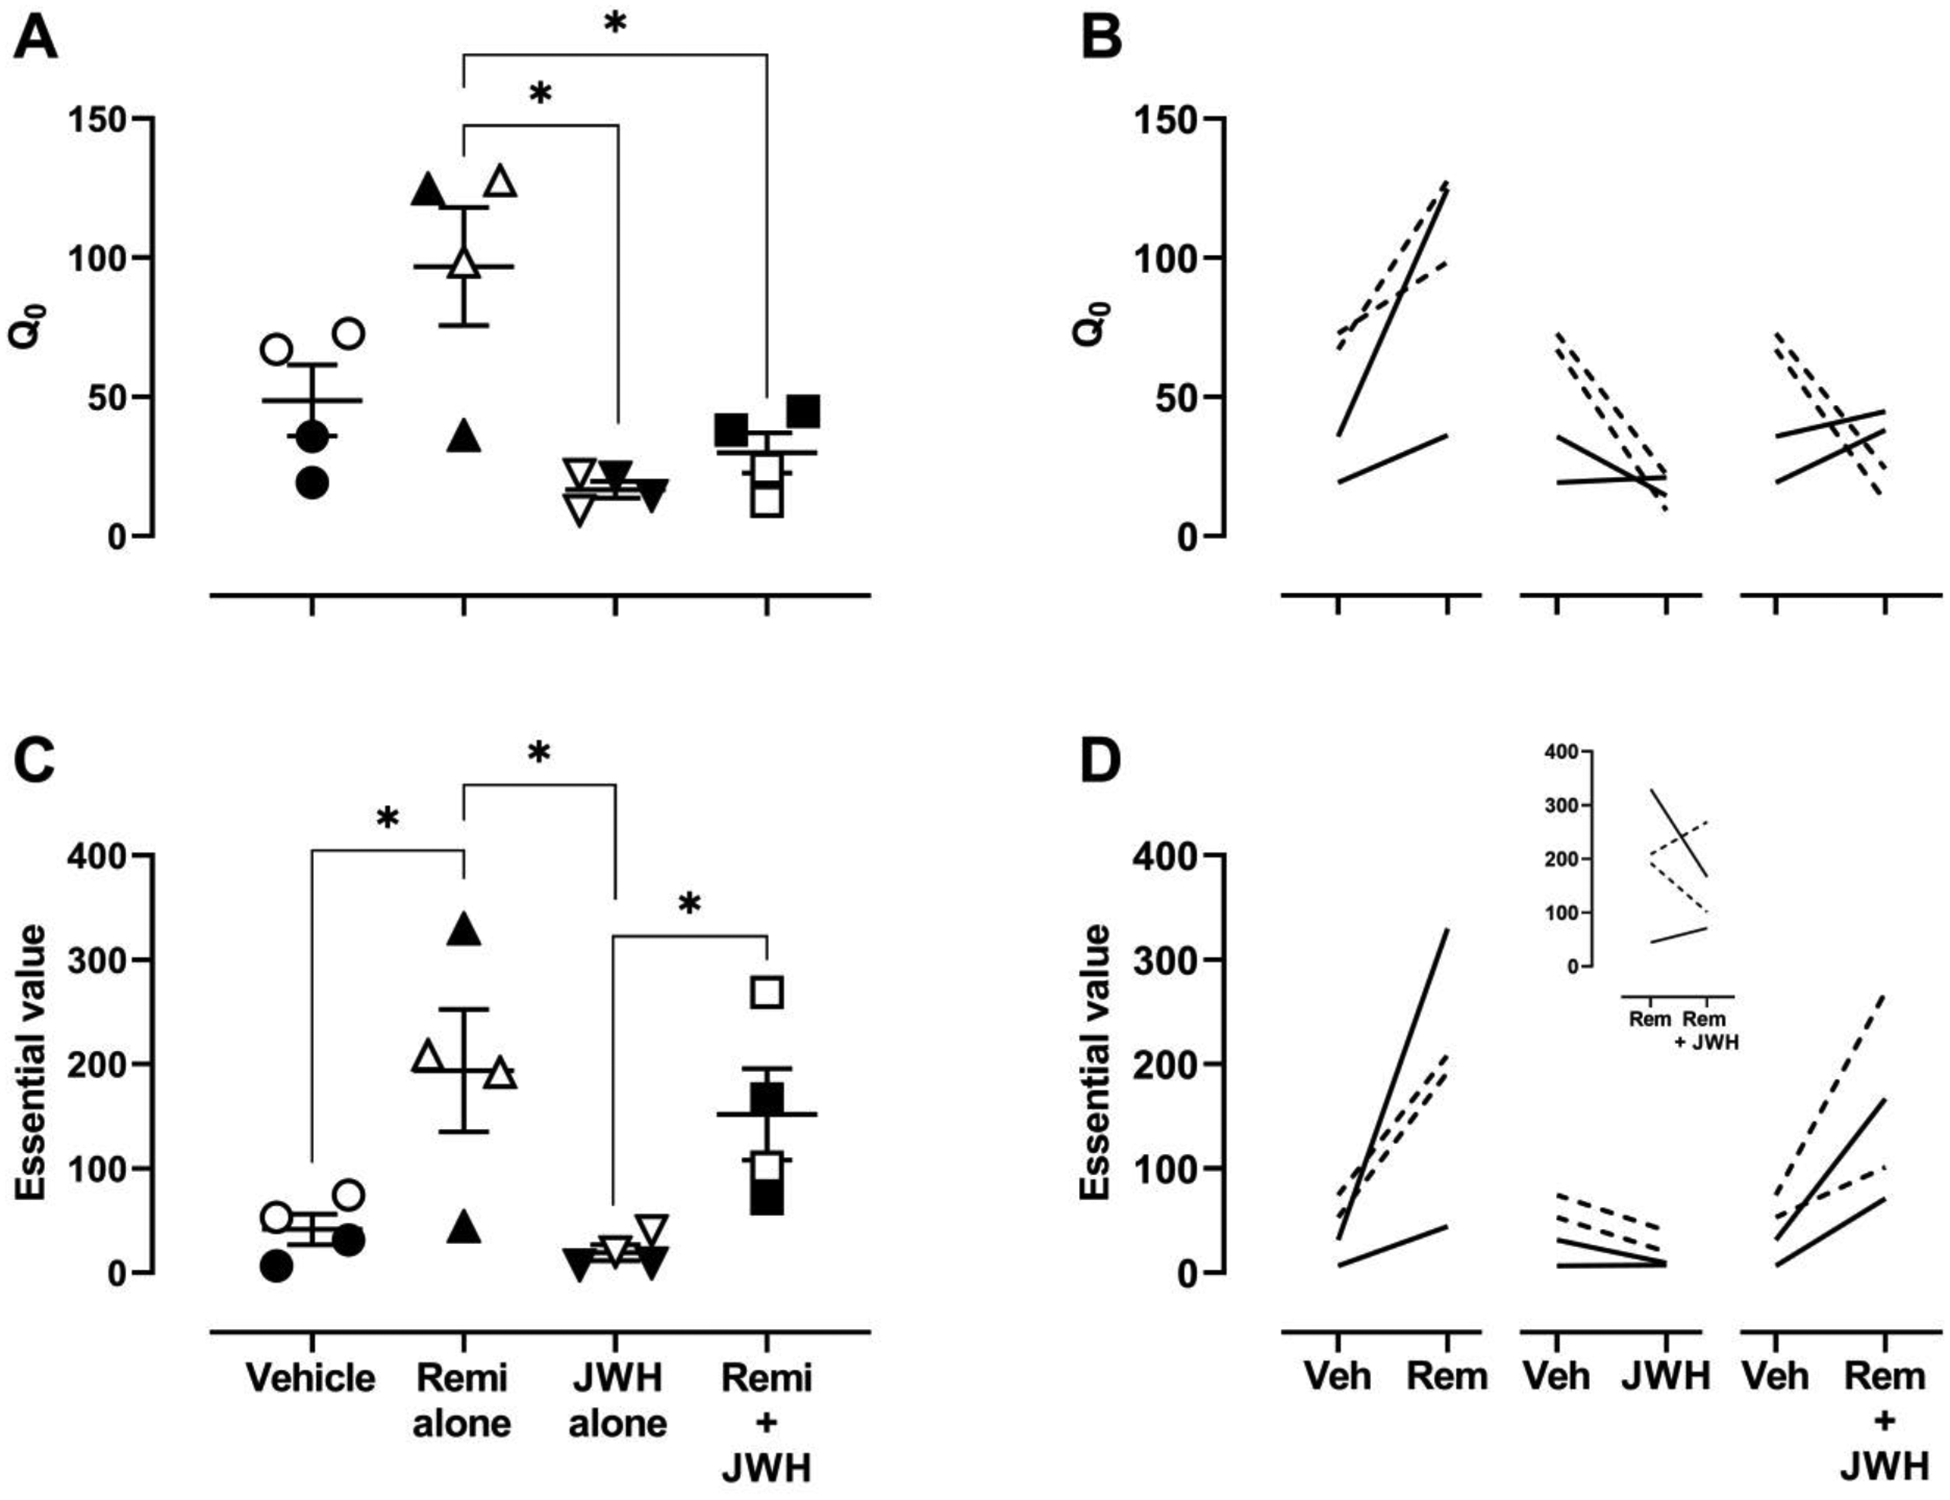
Figure 2.

Parameters derived from the demand curve fits for each of the solutions available for self-administration. Estimates of consumption at a minimal cost (Q0; Equation 1) are plotted in the top panels whereas estimates of essential value (EV; Equation 2) are plotted in the bottom panels. In panels A and C, each data point indicates the mean value for an individual monkey across two determinations. The longer horizontal lines indicate the mean for the group, and error bars indicate ± 1 standard error of the mean. Filled symbols show data from males and unfilled symbols show data from females. Brackets with an asterisk indicate pairs of conditions that are statistically different (p<.05). Panels B and D show parameters for vehicle compared with each of the other solutions for individual monkeys; the inset in panel D shows a comparison of essential value between remifentanil alone and in combination with JWH-018. Solid lines show data from males and dashed lines show data from females.
