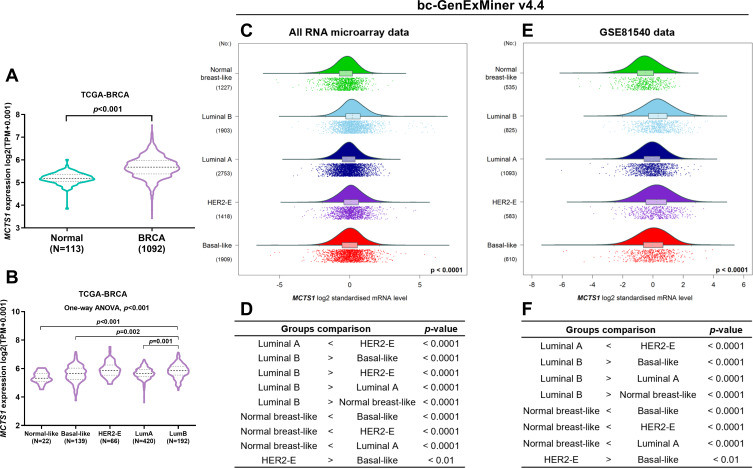
Figure 1.
MCTS1 expression was upregulated in breast cancer but showed significant variations in PAM50 subtypes. (A) A violin chart showing MCTS1 expression between breast cancer and adjacent normal cases in TCGA-BRCA. (B) MCTS1 expression among PAM50 subtypes in TCGA-BRCA. One-way ANOVA, with post hoc Tukey’s multiple comparisons test was conducted. (C–F) Data mining in Breast cancer Gene-Expression Miner v4.4 was performed to explore MCTS1 expression profile and to compare the difference between PAM50 subtypes in all microarray datasets in GEO (C, D) and in RNA-seq data from GSE81540 (E, F).

