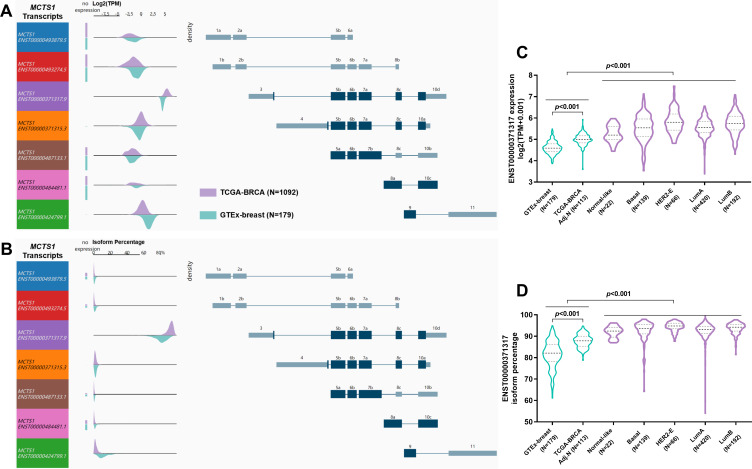
Figure 2.
MCTS1 transcript profiles in normal and breast cancer tissues. (A, B) MCTS1 transcript expression (A) and isoform percentage (B) in normal breast tissues from GTEx-breast and cancer tissues from TCGA-BRCA. Each row in visualization shows the transcript and transcript structure. Density plots show the range of expression of the corresponding transcript. (C, D) Violin plot charts showing MCTS1 transcript expression (C) and isoform percentage (D) in normal breast tissues from GTEx-breast and in the PAM50 subtypes of breast cancer.

