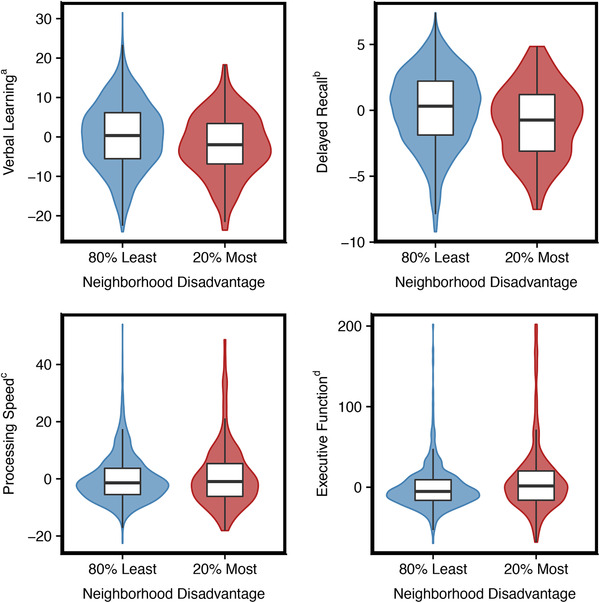
FIGURE 1.

Cognitive function factor score box plots by neighborhood disadvantage. aRey Auditory Verbal Learning Test (RAVLT) 1‐5, bRAVLT delayed, cTrail A (seconds), dTrail B (seconds); ADI, Area Deprivation Index. For RAVLT outcomes, higher scores indicate better cognitive function. For trailmaking outcomes, higher scores indicate poorer cognitive function. Outcomes adjusted for age, gender, race, education, parental history of dementia, and study cohort. Red is the 20% most disadvantaged group. Blue is the 80% least disadvantaged group. Color width is the density of observation points at that unit of measure
