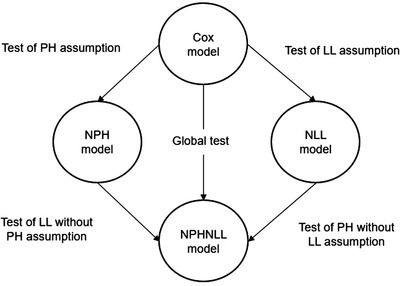
FIGURE 1.

Testing of assumptions and finding best model. Arrows represent likelihood ratio test. Comparing models by likelihood ratio tests the assumptions of proportional hazards (PH) and log‐linearity (LL), and the best fitting model for the predictor is identified. This figure is adapted from Mahboubi et al 27
