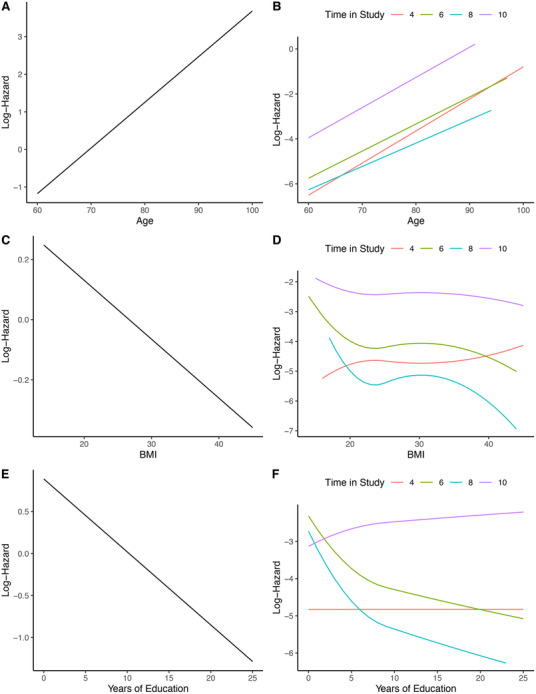
FIGURE 2.

Estimated log‐hazards from crude Cox models (CMs) and generalized Cox models. Graphs A, C, and E show estimated log‐hazards for age, body mass index (BMI), and years of education from crude CMs; graphs B, D, and F show estimated log‐hazards, for each follow‐up time point, for age from a crude non proportional hazards model (NPH), BMI, and years of education from crude non proportional hazards and non log linear models (NPHNLL)
