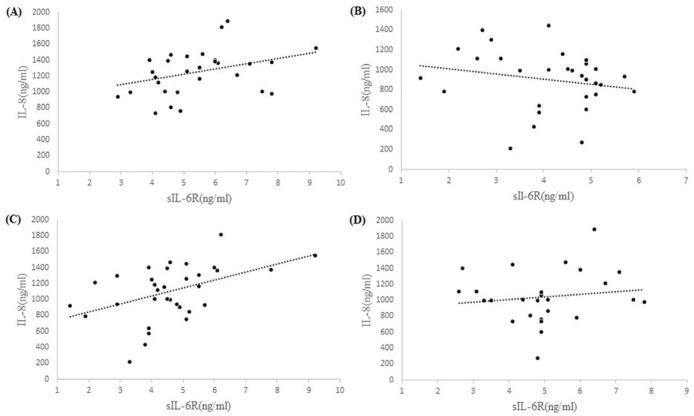
Figure 3.
Correlation between IL-8 and sIL-6R in MM (A), Controls (B), Population of Females (C) and Population of Males (D). The results show significant correlation in population of females (Pearson’s correlation =0.45, P=0.008). Correlations are in patients (Pearson’s correlation =0.34, p=0.06), controls (Pearson’s correlation = -0.20, P= 0.28), and population of males (Pearson’s correlation =0.13, P=0.51).

