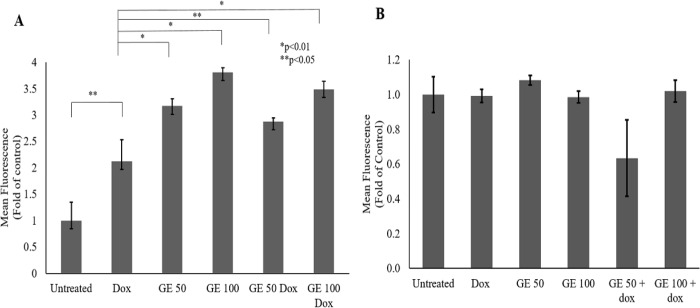
Figure 5.
Effect of GE on Intracellular ROS Level in 4T1 and NIH-3T3 Cells. The total ROS level after a single and combination treatment of GE with Dox were observed with a DCFDA staining assay. 4T1 and NIH-3T3 cells (5 × 10⁴ cells/mL) were treated with GE 50 and 100 μg/mL, Dox (100 nM), and in combination for 4 h, then subjected to ROS detection using flow cytometry (n = 3). (A) ROS level profile of 4T1 cells on indicated treatments (b) ROS level profile of NIH-3T3 cells on indicated treatments. The significance between treatments was determined using a t-test

