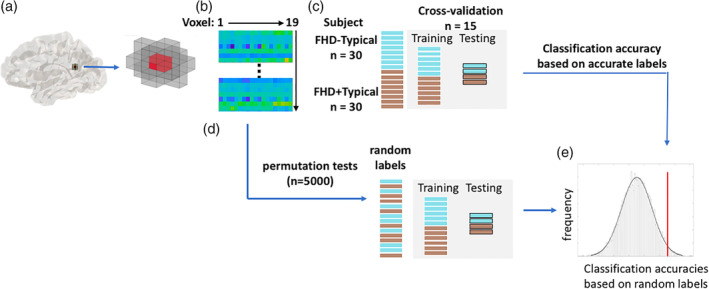
Figure 1.

Flow chart of a step‐by‐step procedure of the whole‐brain searchlight multivariate pattern analysis. (a) For every voxel (in red), a spherical searchlight was created with a radius of 6 mm (2‐voxel radius, resulting in 19 voxels in total). (b) A 19 × 60 matrix was generated using the values derived from the contrast maps for all included voxels and all participants. (c) A linear support vector classifier (SVC, LIBSVM—http://www.csie.ntu.edu.tw/~cjlin/libsvm) was trained and estimated for the classification performance using the generated matrix. To make an unbiased estimation of the classification accuracies, a 15‐folder cross‐validation approach was adopted. During each iteration, a classifier was trained on 14 folders of subgroups (28 FHD−Typical and 28 FHD+Typical participants) and then used to predict the labels of the remaining folder—that is, 2 FHD−Typical and 2 FHD+Typical. The process was repeated 15 times such that each subject was tested once, and the prediction accuracies of the SVC were estimated across all subjects. (d) Permutation tests (n = 5,000) were subsequently run, in which group labels were randomly assigned to each subject. (e) The significance of the classification accuracy was determined through comparison to the distribution of classification accuracies based on the random labels
