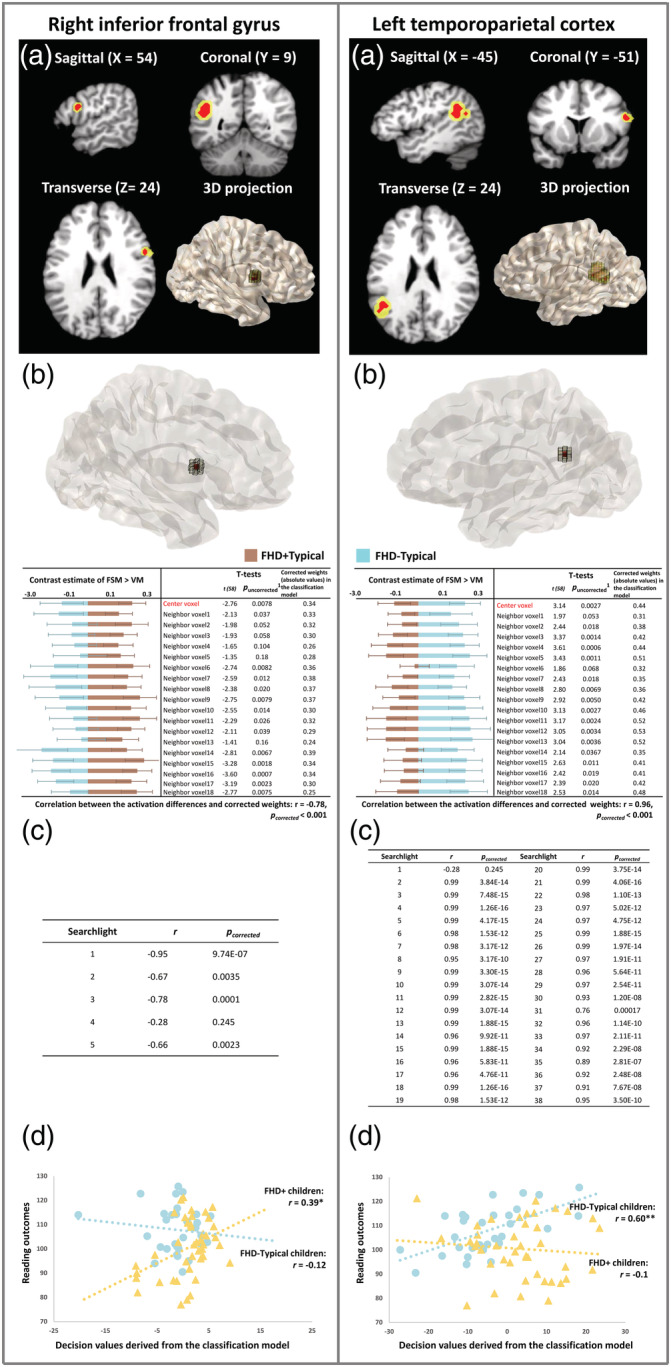
Figure 2.

The right inferior frontal gyrus (RIFG, left section) and the left temporo‐parietal cortex (LTPC, right section) exhibit distinct activation patterns between the FHD−Typical and FHD+Typical children, as revealed by the whole‐brain searchlight MVPA. Panel (a) shows RIFG and LTPC in slice‐views and 3D projections; the significant regions are highlighted in yellow and the center voxels in red. Panel (b) illustrates that differences between the two groups of children in each voxel included in one example searchlight are significantly correlated with the contribution (corrected weight) of each of those voxels to the classification performance. Each representative searchlight is projected to a 3D image (center voxel in red). The bar figures below the images display the activation levels (contrast estimates of FSM > VM) for FHD+Typical (brown) and FHD−Typical children (blue) in each voxel. The tables show the statistical results of the group comparisons in each voxel and the absolute values of corrected weights in the classification model. Panel (c) summarizes the correlation results for all significant searchlights. Panel (d) shows the correlation results between the decision values derived from the classification models and the subsequent reading outcomes in FHD+ (yellow) and FHD−Typical (blue) children in both RIFG and LTPC regions. Whole‐brain results are reported at p corrected < .05, Bonferroni‐corrected for multiple comparisons. 1The results of the two‐sample t‐tests on the activation levels between the FHD+Typical and FHD−Typical groups in each voxel are not significant after FDR correction (p corrected > .9). *p corrected < .5; **p corrected < .005
