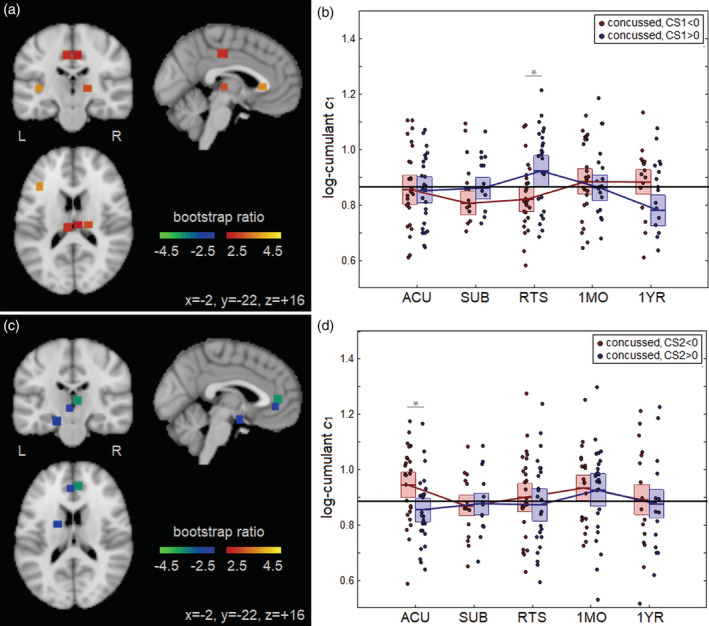
Figure 4.

(a) Brain regions of interest (ROIs; square patches) where c1 during concussion recovery is significantly affected by CS1. (b) Distribution of concussed athlete c1 values, averaged over significant ROIs, plotted for each imaging session; distributions are plotted for CS1 < 0 and CS1 > 0 subgroups. (c) Brain ROIs (square patches) where c1 during concussion recovery is significantly affected by CS2. (d) Distribution of concussed athlete c1 values, averaged over significant ROIs, plotted for each imaging session; distributions are plotted for CS2 < 0 and CS2 > 0 subgroups. For the distribution plots, horizontal red/blue lines denote group means and boxes indicate 95% confidence intervals; distribution means are connected between sessions by solid red/blue lines; the mean c1 value for controls is plotted as the thick horizontal black line. The c1 values were obtained from ROIs showing significant interaction with CS1 or CS2, noted with “*” (false discovery rate [FDR] = 0.05 threshold)
