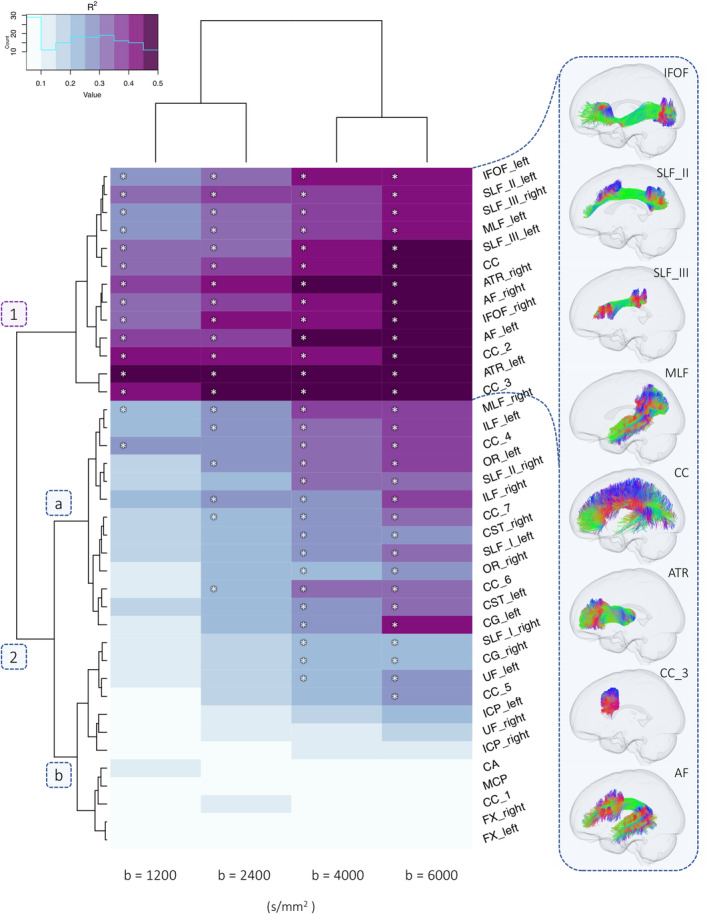
Figure 3.

Dendrogram heatmap highlighting clusters of tracts which differentially describe age‐related differences in apparent fibre density (AFD) across various single‐shell b‐value sampling schemes. Heatmap colour intensity reflects range of R 2 values derived from a linear model including age, sex, and RMS displacement. Significant age‐effects (p < 3.3e‐4) are annotated with an asterisk (*). A depiction of several fibre pathways in one cluster is presented on the right
