Figure 5.
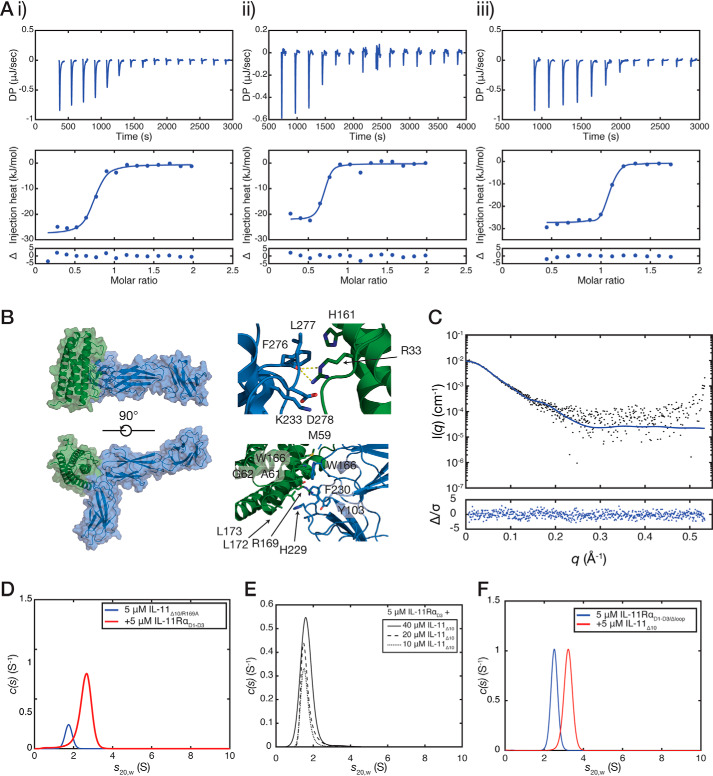
Thermodynamics and molecular model of the interaction between IL-11 and IL-11Rα. A, isothermal titration calorimetry isotherms for the interaction between IL-11Δ10 and IL-11RαEC (KD = 40 ± 20 nm) (panel i), between IL-11Δ10 and IL-11RαD1–D3 (KD = 23 ± 3 nm) (panel ii), and between IL-11Δ10 and IL-11RαD1–D3/Δloop (KD = 8 ± 4 nm) (panel iii). A representative titration of three replicates is shown for each. All experiments were conducted at 30 °C (303 K) with ∼10 μm IL-11Rα in the cell and a 10-fold molar excess of IL-11Δ10 in the syringe. B, model of the IL-11RαEC–IL-11Δ10 complex. Panel i, two views of the complex. Panel ii, details of the interface with residues previously implicated in receptor binding highlighted. C, the experimental SAXS profile for the IL-11Rα–IL-11Δ10 complex overlaid with the theoretical scattering profile calculated from the model coordinates (χ2 = 1.03). An ab initio model is presented in Fig. S9D. D, continuous sedimentation coefficient (c(s)) distributions for the complex between IL-11RαD1–D3 and IL-11Δ10/R169A. The broad peak in the c(s) distribution suggests that the complex formed is lower affinity compared with IL-11Δ10. E, c(s) distributions showing that IL-11RαD3 does not interact with IL-11Δ10 at high affinity. No significant complex formation was observed with increasing concentrations of IL-11Δ10 in the presence of 5 μm IL-11RαD3. F, c(s) distributions for the complex between IL-11RαD1–D3/Δloop and IL-11Δ10. The complex was formed by mixing 5 μm IL-11RαD1–D3/Δloop with 5 μm IL-11Δ10 and centrifuged without further purification.

