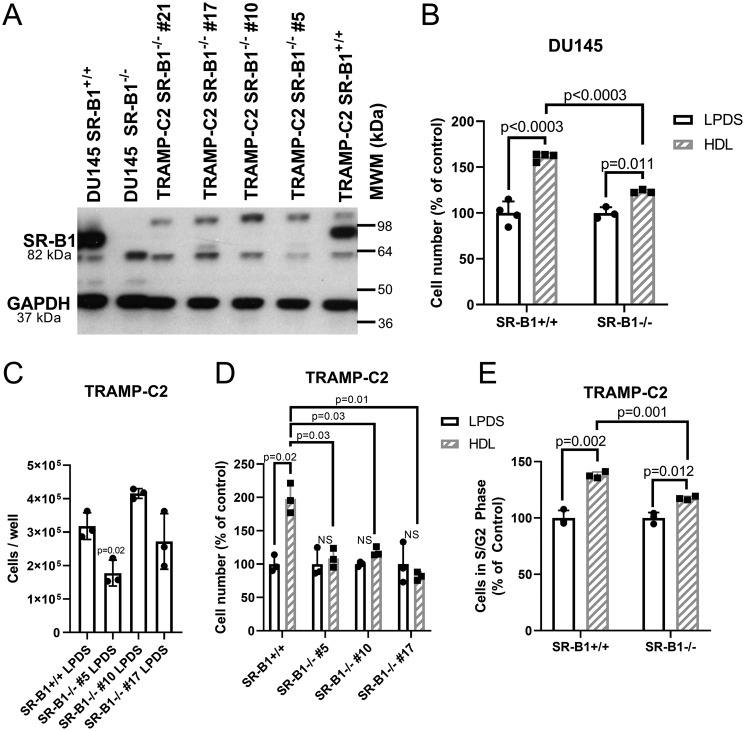
Figure 4.
HDL effects in WT and SR-B1 KO cells. A, Western blotting for SR-B1 in WT and SR-B1 KO DU145 and TRAMP-C2 cells. B, cell accumulation assay for DU145 WT and SR-B1 KO cells incubated ±300 μg/ml of HDL in LPDS for 3 days (n = 3–4; mean ± S.D.; t test with Bonferroni correction for 3 tests; p values displayed). C, cell number of SR-B1+/+ TRAMP-C2 cells and three independent SR-B1−/− clonally derived cell lines after incubation in 10% LPDS for 3 days (n = 3; mean ± S.D.; ANOVA with Dunnett's post test comparing to SR-B1+/+ cells; p value displayed). D, cell accumulation in TRAMP-C2 SR-B1+/+ and three SR-B1−/− clones incubated ±200 μg/ml of HDL for 3 days normalized to each cell lines LPDS control (n = 3; mean ± S.D.; t test with Bonferroni correction for 7 tests (4 tests ± HDL for each line and 3 tests of HDL treated SR-B1+/+ versus SR-B1−/− clones), significant p values displayed). E, cell cycle analysis in TRAMP-C2 SR-B1+/+ and SR-B1−/− cells treated ±300 μg/ml of HDL in LPDS media for 1 day (% of cells in S + G2 phases; n = 3; mean ± S.D.; t test with Bonferroni correction for 3 tests, p values displayed). NS, not significant.

