
Figure 6.
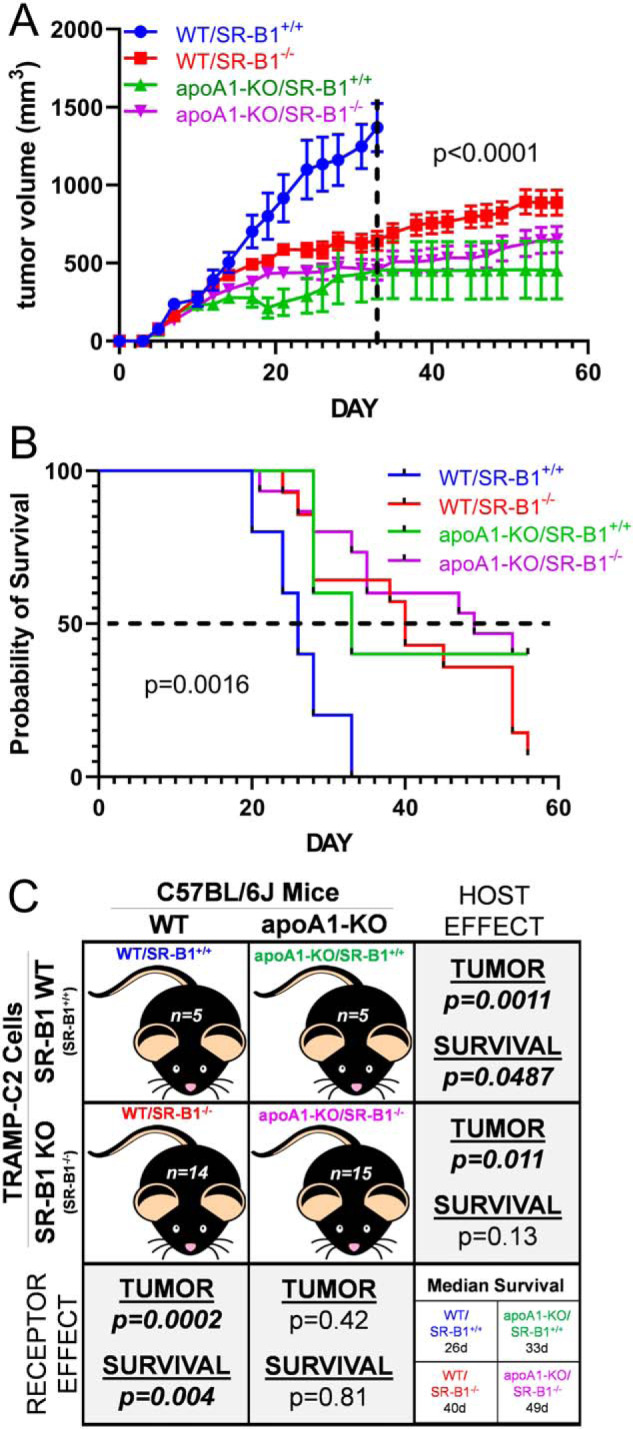
Tumor progression study in vivo. A, tumor volumes of mice injected with 2 × 10⁶ cells in left and right flanks, then followed for 8 weeks. Tumor volume is expressed as mean ± S.E.; WT mice SR-B1+/+ cells (WT/SR-B1+/+, blue) n = 5; WT mice SR-B1−/− cells (WT/SR-B1−/−, red) n = 14; apoA1-KO mice SR-B1+/+ cells (apoA1-KO/SR-B1+/+, green) n = 5; apoA1-KO mice SR-B1−/− cells (apoA1-KO/SR-B1−/−, purple) n = 15. Two-way ANOVA up to day 33, when all groups survived, demonstrated group effects, time effects, and interaction effects all with p < 0.0001. B, Kaplan Meier survival plot (p = 0.0016 by Mantel Cox Log Rank Sum test for all four groups). C, summary of study design and pairwise statistical analysis of host mouse genotype and injected cell genotype effects tumor progression and survival. Tumor volume analyses involving the WT/SR-B1+/+ group, only used data up to day 33. Pairwise two-way ANOVA group effect on tumor volumes p values are displayed. Pairwise survival Mantel Cox Log Rank Sum group effect p values are displayed.