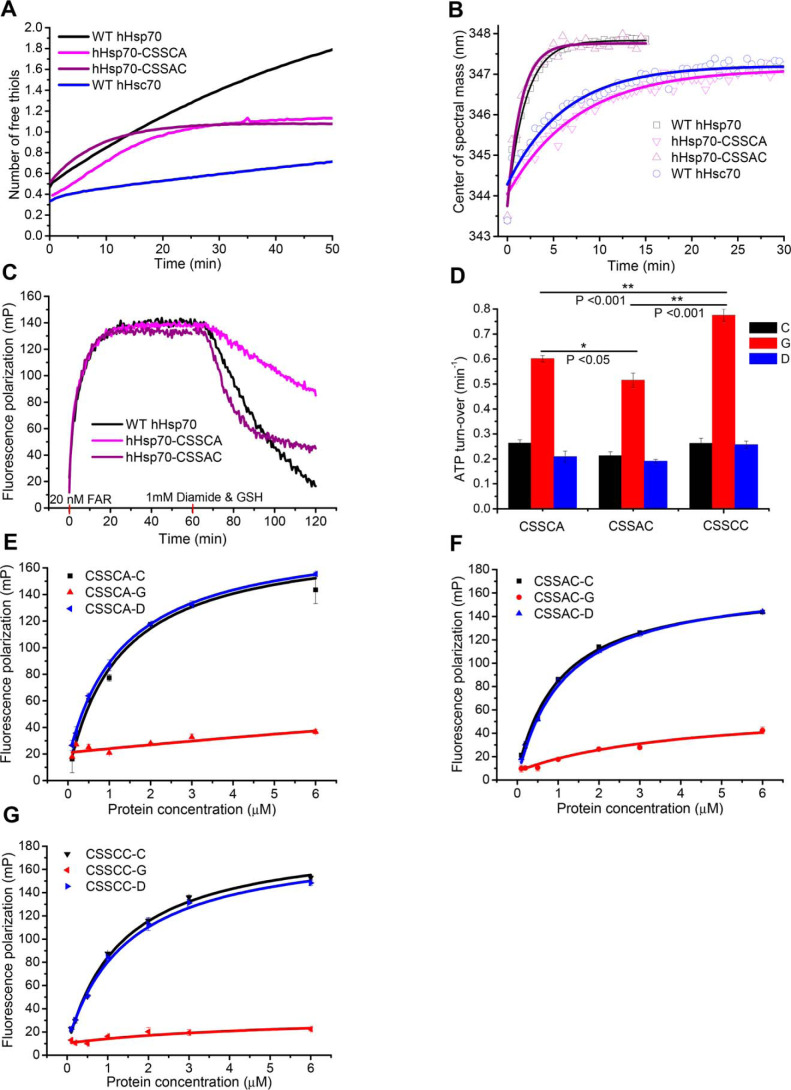
Figure 7.
Characterization of the relative susceptibility of residues Cys-574 and Cys-603 to undergo glutathionylation. A, time course of cysteine reactivity of WT hHsp70 (black), hHsp70-CSSCA (magenta), hHsp70-CSSAC (purple), and WT hHsc70 (blue) in the presence of 0. 5 mm ADP were compared. The data shown are the mean of three independent measurements (each of three replicates). B, time courses of conformational change accompanying glutathionylation of WT hHsp70 (black squares), hHsp70-CSSCA (magenta triangles), hHsp70-CSSAC (purple triangles), and WT hHsc70 (blue circles) in the presence of 0.5 mm ADP were compared by monitoring CSM of the intrinsic fluorescence spectrum. Glutathionylation kinetics were induced by 1 mm diamide and 1 mm GSH. C, kinetics of FAR peptide binding to 10 μm WT hHsp70 (black), hHsp70 CSSCA (magenta), and hHsp70 CSSAC (purple) in the presence of 0.5 mm ADP accompanying glutathionylation were monitored and compared; 20 nm FAR and 1 mm diamide with 1 mm GSH were added at 0 and 60 min, respectively, to initiate peptide binding and glutathionylation in turn. D–G, ATPase activity (D) and peptide binding ability (E–G) of untreated control (-C, black), glutathionylated (-G, red), and deglutathionylated (-D, blue) hHsp70-CSSCA, hHsp70-CSSAC, and hHsp70-CSSCC in the presence of 0.5 mm ADP in Buffer B were compared.

