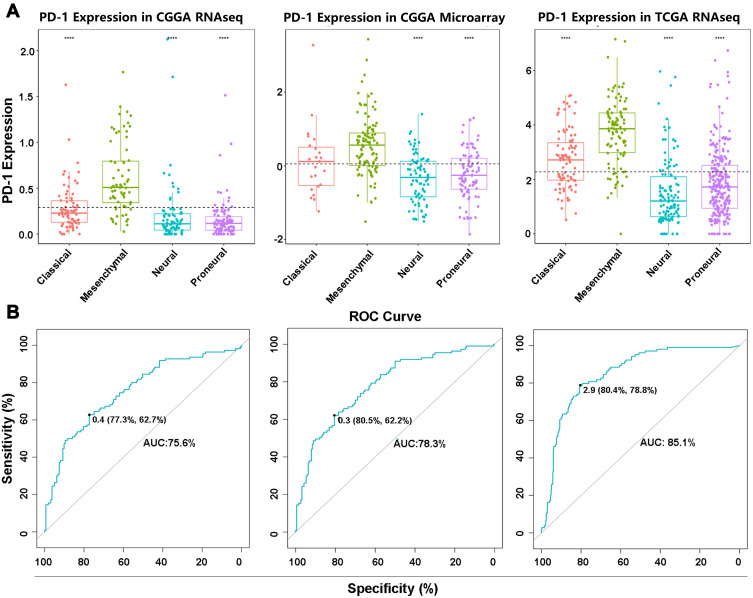
Figure 2.
PDCD1 shows a strong expression pattern in the mesenchymal molecular subtype of GBM. (A) PDCD1 is highly enriched in the mesenchymal molecular subtype of GBM compared with three other subtypes in the CGGA and TCGA datasets. (B) ROC analysis of PDCD1 expression in mesenchymal glioma from the CGGA and TCGA datasets and the area under curves (AUCs) are 0.756, 0.783 and 0.851, respectively. ****p < 0.0001.

