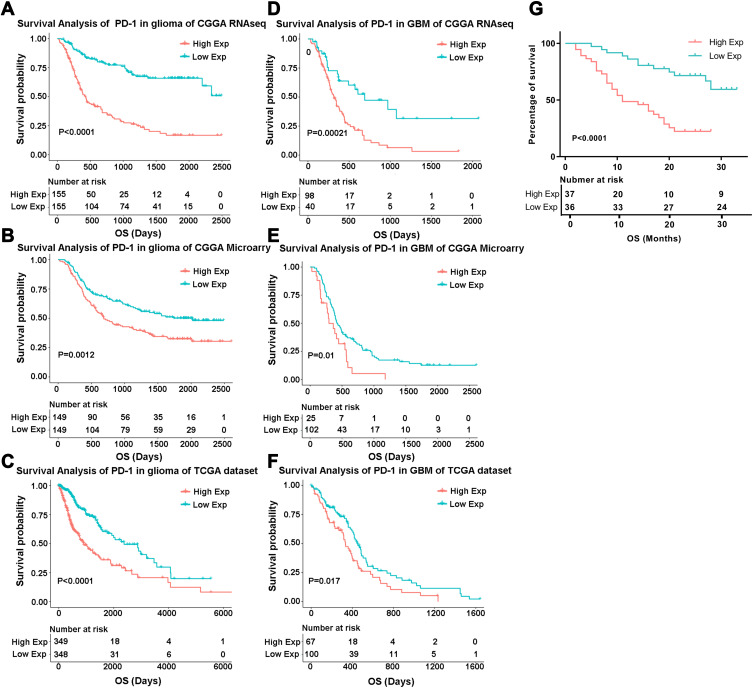
Figure 6.
Survival analysis of PDCD1 expression in glioma. (A–C) Kaplan–Meier analysis of overall survival between the PDCD1high group and the PDCD1low group in diffuse glioma patients in the CGGA and TCGA datasets. (D–F) The difference of overall survival between the PDCD1high group and the PDCD1low group in GBM (WHO, grade IV) patients in the CGGA and TCGA datasets. (G) The difference of overall survival between the PDCD1high group and the PDCD1low group in our own cohort of 73 glioma patients.

