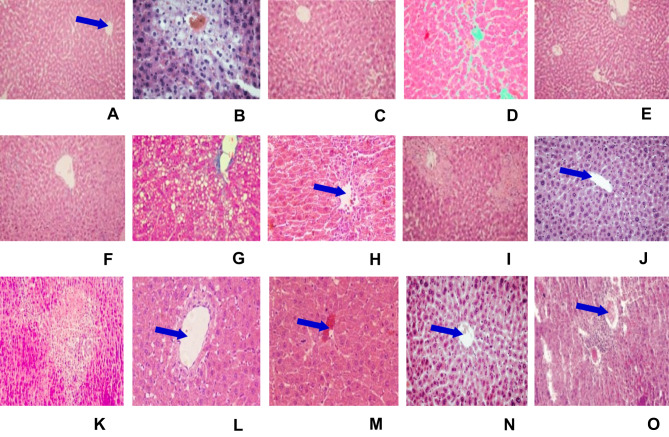
Figure 3.
Microphotograph of hematoxylin and eosin (H & E)-stained sections of liver. Micrometer glass slides were prepared in 50 µm intervals.
Notes: (A) Negative control (received 2%TW80 only), (B) toxicant control (administered with CCl4 only), (C) positive control (silymarin + CCl4), (D) M100 + CCl4, (E) M200 + CCl4, (F) M400 + CCl4, (G) BF100 + CCl4, (H) BF200 + CCl4, (I) BF400 + CCl4, (J) CF100 + CCl4, (K) CF200 + CCl4, (L) CF400 + CCl4, (M) AF100 + CCl4, (N) AF200 + CCl4, (O) AF400 + CCl4. The blue arrow indicates the central vein. Microphotograph of H & E-stained section of liver from a negative control mouse showing normal histological structure (A, ×10). CCl4-treated mouse liver showing necrosis, infiltration, vacuolization, and disarrangement of hepatocytes (B, ×10). The liver section of the mouse administered crude leaf extract showing nearly normal appearance of hepatocytes (F, ×10), whereas, mice pre- and post-treated with n-butanol fraction showed mild degree of liver damage and inflammatory cell, protection from hepatocyte degradation and centrilobular necrosis (H and I, ×10). Silymarin-treated mouse liver showing normal appearance of hepatocytes (C,×10).

