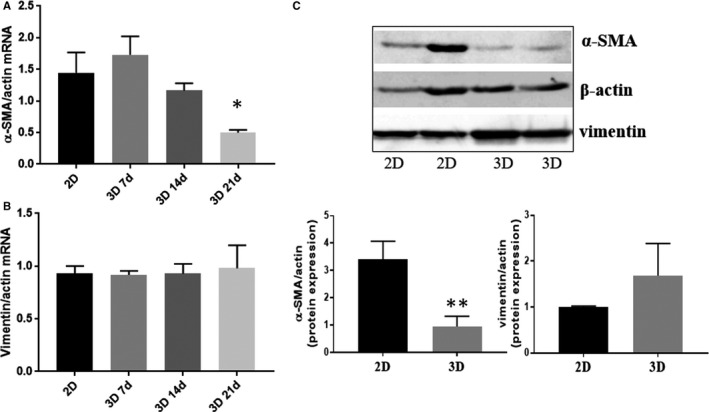
FIGURE 2.

Phenotype of VIC and VEC from the 3D constructs. A and B, mRNA expression of VIC markers, α‐SMA (A) and vimentin (B), in VIC isolated from 3D constructs cultured for different period of time (7, 14 or 21 days), compared with VIC grown in 2D culture (7 days). n = 3, *P < .05, VIC from 3D compared with VIC from 2D. Data depicted as mean ± SD. C, Evaluation of protein expression for α‐SMA and vimentin in VIC isolated from 3D constructs or from 2D culture by Western blot, n = 3, *P < .05, VIC from 3D compared with VIC from 2D
