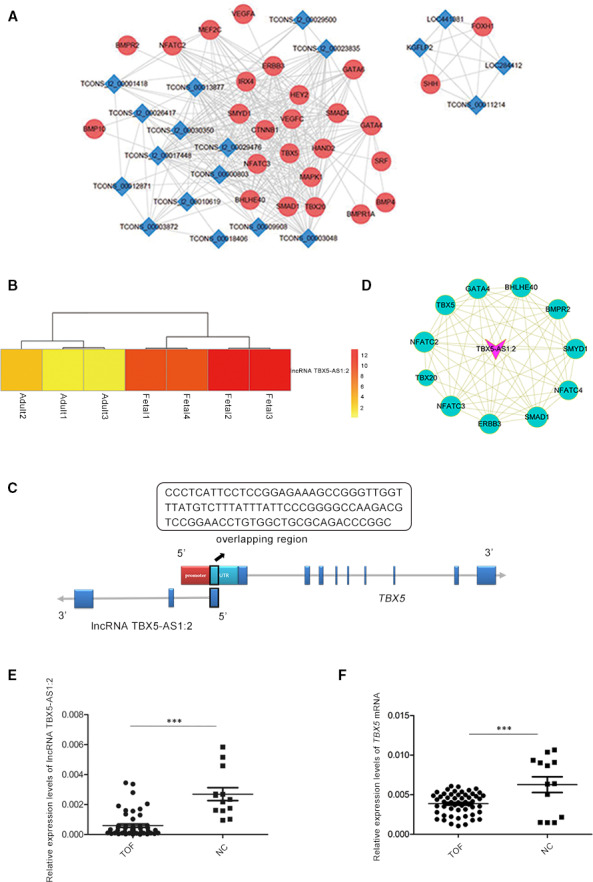
FIGURE 1.

LncRNA TBX5‐AS1:2 was selected by data mining of the GEO database and bioinformatics analysis. A, CNC network of 19 lncRNAs and 26 mRNAs with a standard of PCC ≥0.9 or ≤−0.9 and P ≤ .05. Blue rhombus represents lncRNAs, red circular nodes represent mRNAs, and lines indicate gene co‐expression relationship between lncRNA and mRNA. B, Higher expression of lncRNA TBX5‐AS1:2 in foetal compared with adult hearts. Expression values represented by red and yellow shades, indicating expression above and below the median across all samples, respectively. C, Relative positions of lncRNA TBX5‐AS1:2 and its nearby gene TBX5 on the chromosome. LncRNA TBX5‐AS1:2 is localized at the antisense chain of the coding gene TBX5, with overlapping and complementary regions. Black highlighted region indicates the overlapping region (92 bp), and its sequence is presented in the above box. Blue boxes indicate exons. D, CNC network of lncRNA TBX5‐AS1:2 and 11 mRNAs. Rose V represents lncRNA TBX5‐AS1:2, green circular nodes represent mRNAs, and node size indicates the gene expression level (larger dot, higher expression level). Lines represent the gene co‐expression relationship between lncRNA TBX5‐AS1:2 and mRNA (full lines, positive correlation; dashed lines, negative correlation). E and F, LncRNA TBX5‐AS1:2 and TBX5 were significantly down‐regulated in TOF cardiac tissue samples compared with normal control (NC) by qPCR analysis. Values are mean ± SEM, n = 3, ***P < .0001. CNC, coding and non‐coding; GEO, Gene Expression Omnibus; lncRNAs, long non‐coding RNAs; PCC, Pearson's correlation coefficient; qPCR, quantitative polymerase chain reaction; TOF, Tetralogy of Fallot
