
Figure 1.
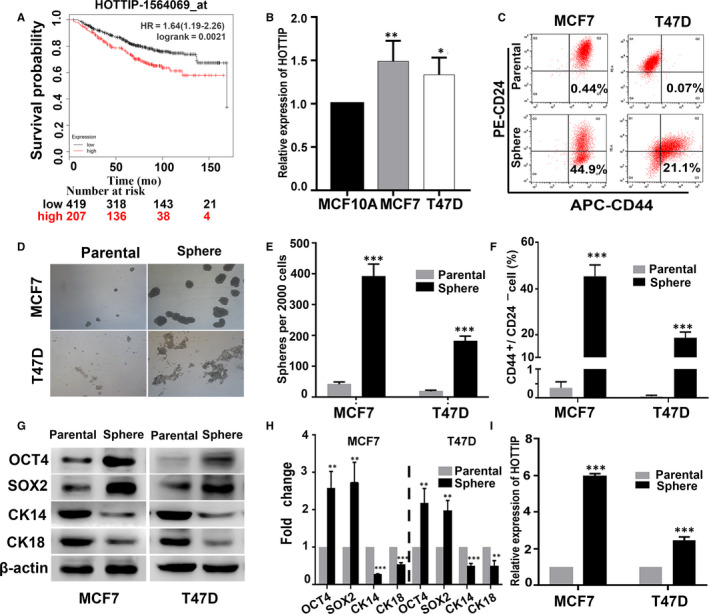
The high expression of HOTTIP in breast cancer and BCSCs. A, The relationship between HOTTIP expression and the outcomes of breast cancer patients was analysed using the online tool, KM plotter (http://www.kmplot.com). B, The expression of HOTTIP by qRT‐PCR analysis in the MCF10A, MCF7 and T47D cells. C, F, The percentage of CD44+/CD24− cells by Flow cytometry in the sphere cells of MCF7 and T47D, and their parental cells. D, E, Sphere formation capacities by sphere formation assay in the spheres cells and the parental cells. G, H, Western blot analysis showing the protein expression levels of OCT4, SOX2 and CK14, CK18 in the sphere cells and their parental cells. I, The relative expression of HOTTIP in sphere cells and parental cells was assessed by qRT‐PCR. Data are presented as mean ± SD. *P < .05, **P < .01, ***P < .001 compared to MCF‐10A or the parental cells