
Figure 3.
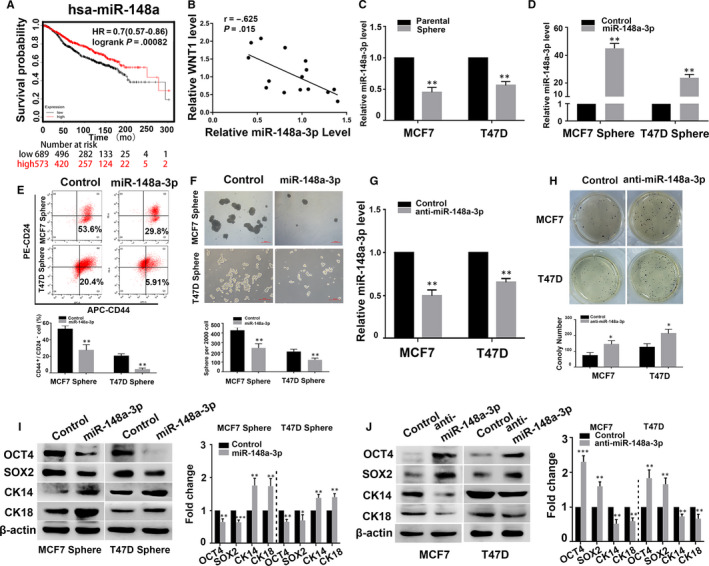
miR‐148a‐3p negatively modulated the stemness of BCSCs. A, The relationship between hsa‐miR‐148a expression and the outcomes of breast cancer patients was analysed using the online tool, KM plotter (http://www.kmplot.com). B, Spearman's correlation coefficient analysis between miR‐148a‐3p expression and WNT1expression in 15 patients with BC. C, The relative expression of miR‐148a‐3p in the sphere cells of MCF7 and T47D, and their parental cells was assessed by qRT‐PCR. D, G, The relative expression of miR‐148a‐3p of the sphere cells transfected with miR‐148a‐3p mimic, and the parental cells transfected with miR‐148a‐3p inhibitor by qPCR analysis. E, The percentage of CD44+/CD24‐ BCSCs subpopulations determined in the miR‐148a‐3p mimic‐transfected sphere cells by flow cytometry. F, The self‐renewal capacity of the miR‐148a‐3p mimic‐transfected sphere cells was analysed by sphere formation assays. H, The clone formation ability of the miR‐148a‐3p inhibitor‐transfected parental cells was detected by soft‐agar colony formation. I, J, The protein levels of OCT4, SOX2 and CK14, CK18 in the miR‐148a‐3p mimic‐transfected sphere cells and the miR‐148a‐3p inhibitor‐transfected parental cells by Western blot. Data are presented as mean ± SD. * P < .05, ** P < .01 compared to control group